Programming Languages
In this section, we show how to interface the Time Tagger and perform measurements using the supported programming environments. The Time Tagger API is implemented in C++ and exposed to several higher-level languages via wrapper libraries (Python, MATLAB, LabVIEW, .NET). More details about the software interface are covered by the API documentation in the Application Programming Interface chapter.
Before you begin, ensure the Time Tagger software is installed; if not, see Installation Instructions. Also make sure your Time Tagger device is connected to your computer and not in use by other applications (e.g., close Time Tagger Lab).
Python
Make sure a Python distribution is available. We provide full support for actively supported Python versions <https://devguide.python.org/versions/>_,. Older versions, while untested, might still work.
On Unix/Linux systems, a system-supported installation of Python should already be present.
On Windows systems, you can install Python by following these instructions. We recommend the default installation (“Install Now”), as it includes all standard libraries and pip.
Make sure to install the required Python package (NumPy) as well as the recommended ones (Matplotlib, and ipython).
Open a command shell and navigate to the
.\examples\python\1-Quickstartfolder in your Time Tagger installation directory.Start an ipython shell with plotting support by entering
ipython --pylab.Run the hello_world script by entering
run hello_world.
The hello_world executes a simple yet useful measurement that demonstrates many essential features of the Time Tagger programming interface:
Connects your Time Tagger.
Starts the built-in test signal (~0.8 MHz square wave) and apply it to channels 1 and 2.
Controls the trigger level of your inputs - although it is not necessary here.
Initializes a standard measurement (Correlation) in order to find the delay of the test signal between channel 1 and 2.
Shows how to control the delay of different inputs programmatically.
You are encouraged to open and read the hello_world file in an editor to understand what it does.
With this basic knowledge, you can explore the other examples in the 1-Quickstart folder:
No. |
Topic |
Classes & Methods |
|---|---|---|
Basic software control (folder 1-basic_software_control) |
||
1-A |
Create a measurement |
|
Count rate trace |
||
1-B |
Start & stop measurements |
|
1-C |
Synchronize measurements |
|
Use different histograms |
||
1-D |
Virtual Channels |
|
1-E |
Logging errors |
|
1-F |
External reference clock |
|
Controlling the hardware (folder 2-controlling-the-hardware) |
||
2-A |
Get hardware information |
|
2-B |
The input trigger level |
|
2-C |
Filter tags on hardware |
|
2-D |
Control input delays |
|
2-E |
Overflows |
|
2-F |
HighRes mode |
|
Dump and re-analyze time-tags (folder 3-dump-and-reanalyze-time-tags) |
||
3-A |
Dump tags by FileWriter |
|
3-B |
The Time Tagger Virtual |
|
Working with raw time-tags (folder 4-working-with-raw-time-tags) |
||
4-A |
The FileReader |
|
4-B |
Streaming raw time-tags |
|
4-C |
Custom Measurements |
|
LabVIEW (via .NET)
In LabVIEW, you can access and program your Time Tagger through .NET interoperability.
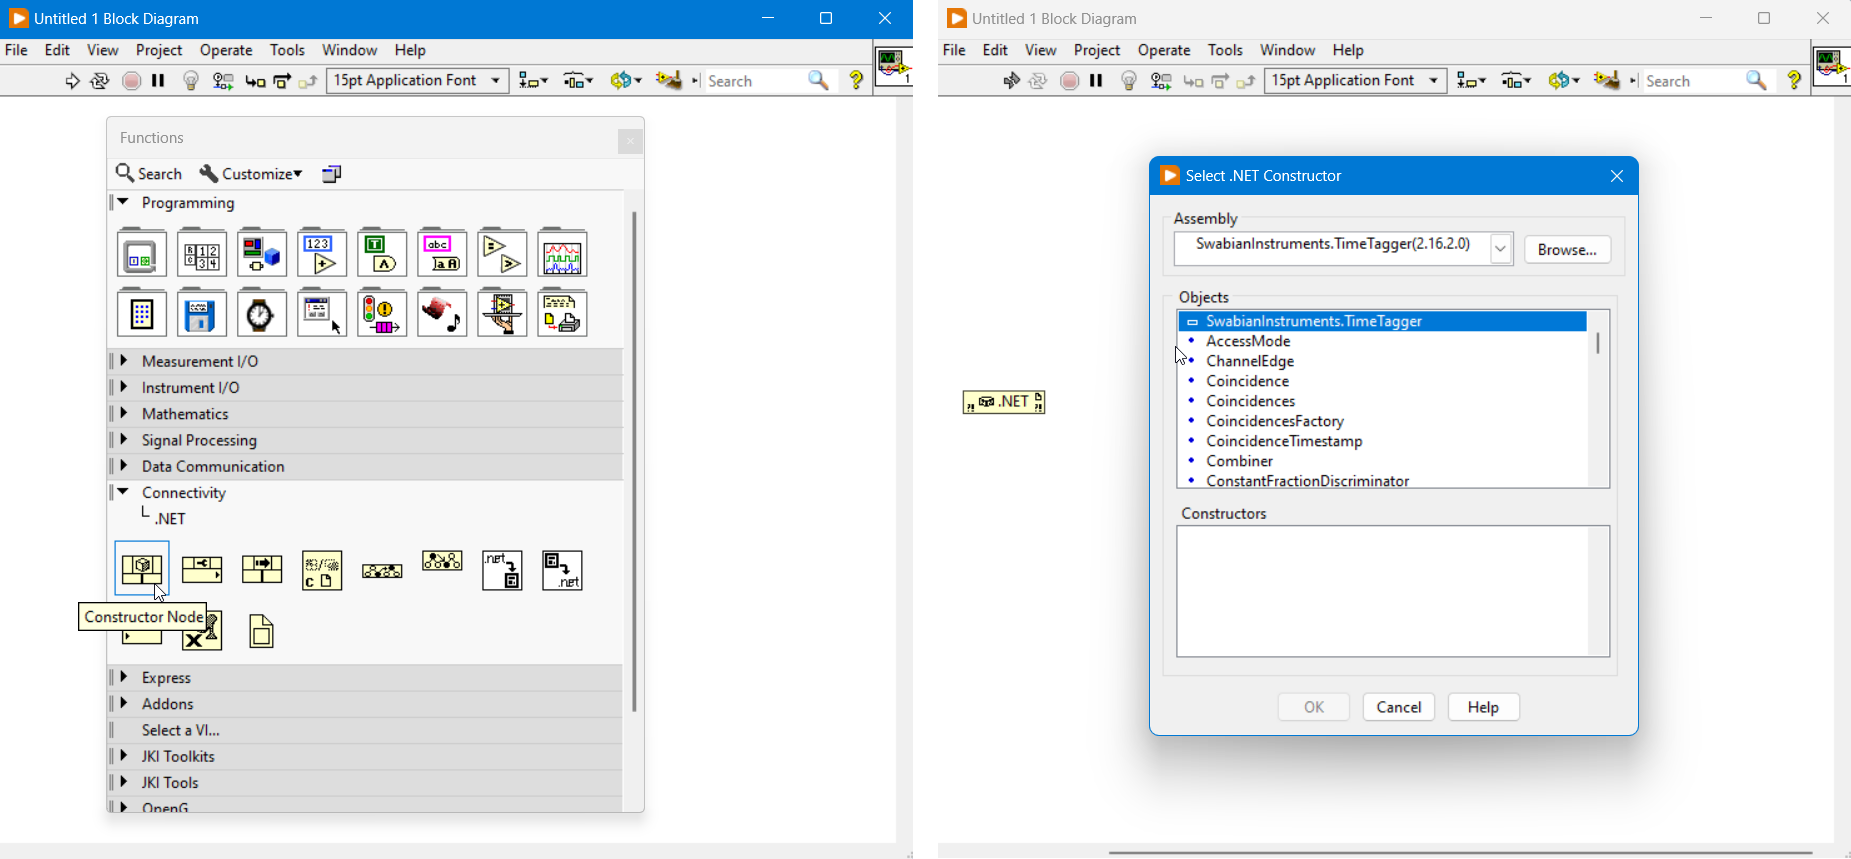
A set of examples is provided in .\examples\LabVIEW\ for LabVIEW 2014 and higher (32 and 64 bit).
MATLAB (wrapper for .NET)
Wrapper classes are also provided for MATLAB.
The Time Tagger toolbox is automatically installed during the setup. If the TimeTagger is not available in your MATLAB
environment try to reinstall the toolbox from .\driver\Matlab\TimeTaggerMatlab.mltbx.
The following changes in respect to the .NET library have been made:
Static functions are available through the TimeTagger class.
All classes except for
TimeTagger,TimeTaggerNetwork, andTimeTaggerVirtualhave aTTprefix (e.g.TTCountrate) to prevent conflict with any variables/classes in your MATLAB environment.
Several examples demonstrating how to use the Time Tagger with MATLAB are provided in the .\examples\Matlab\ folder.
The 1-Quickstart directory has the same structure of the Python one (see Table above).
These examples cover core topics such as basic measurements, hardware control, and postprocessing,
providing a one-to-one correspondence between MATLAB and Python usage.
.NET
We provide a .NET class library (32, 64 bit and CIL) which can be used to access the TimeTagger from many high-level languages. Please consider the following notes:
Namespace:
SwabianInstruments.TimeTagger.The corresponding library
.\driver\xxx\SwabianInstruments.TimeTagger.dllis registered in the Global Assembly Cache (GAC).Static functions (e.g. to create an instance of a TimeTagger) are accessible via
SwabianInstruments.TimeTagger.TT.
C#
A sample Visual Studio C# project provided in the .\examples\csharp\Quickstart
directory covers the basics of how to use the Time Tagger .NET API.
An example of creating a custom measurement is also included.
Please copy the project folder to a directory within the user environment such that files can be written within the directory.
An example suite is provided in the .\examples\csharp\ExampleSuite directory.
ExampleSuite is an interactive application that demonstrates various measurements that can be performed with the Time Tagger.
Reference source code to setup and plot (with OxyPlot) each measurement is also provided within the application.
Additionally, the application contains examples for creating and using Virtual channels, Filtering and Accessing the raw time tags.
Note
Running the Example Suite requires ‘.NET Core 3.1 Desktop Runtime (v3.1.10)’.
C++
The provided Visual Studio C++ project can be found in .\examples\cpp\.
Using the C++ interface supports writing custom measurement classes with no overhead.
Note
the C++ headers are stored in the
.\driver\include\folder.the final assembly must link
.\driver\xYZ\TimeTagger.lib.the library
.\driver\xYZ\TimeTagger.dllis linked with the shared v142 or newer Visual Studio runtime (/MD).use
TimeTaggerD.libandTimeTaggerD.dllfor the Visual Studio debug runtime (/MDd).use
libTimeTagger.dllandlibTimeTagger.afor the MinGW C++ ABI for the MINGW32 and UCRT64 environment.
Debug and Release Builds
The choice of build type can have a great effect on the code performance.
In Visual Studio, the default compiler flags for Debug builds are /MDd, /O0, and /Zi. For Release builds these are /MD, /O2, and /DNDEBUG.
It is crucial that you understand these flags and their implications on performance.
/O0vs/O2This flag controls the general optimization level.
/O0means no optimization, so every instruction is surrounded byload_from_memoryandstore_to_memory. This is a significant waste of CPU resources, but guarantees that every local variable can be inspected at all times. We suggest the use of the default optimization level/O2and to overwrite it only for required methods using pragmas (see the MSVC optimize pragma).
/MDdvs/MDThis flag selects which (incompatible) runtime C++ ABI you want to use for the whole project. The debug runtime
/MDdhas additional fields and checks for e.g. better range checking. It is good practice to run your code with them at least once before each commit. As they are incompatible with each other, all linked C++ libraries must use the same runtime. This flag is the only difference between our debugTimeTaggerD.dlland non-debugTimeTagger.dlllibrary. We suggest using/MDeven for debug builds, otherwise the debug runtime will incur significant performance costs, including in the internals of the Time Tagger library.
/ZiThis flag tells the compiler to generate a
*.pdbsymbol file. This is used by the debugger to map e.g. the assembly to the C++ code and the stack to the local variable. As this has no performance overhead, we recommend using this flag for all internal builds.
/DNDEBUGThe macro
NDEBUGis the C way to disableassert(). Asserts are usually good at catching logic errors without much overhead.
The relevant choice is thus not whether to build using Debug or Release, but rather which set of flags to use. Please select each of them carefully based on your target.
Code Sanitizers
We recommend the use of code sanitizers. Switching your Visual Studio compiler to CLANG allows you to use its undefined behavior, address, and thread sanitizers. Microsoft has also recently announced the MSVC compiler now ships with an address sanitizer, which finds out-of-bounds accesses, use-after-free and similar issues. Please consult the documentation for the AddressSanitizer (ASan) for Windows with MSVC.