Getting started with Time Tagger Lab
Time Tagger Lab is the Windows GUI for Swabian Instruments’ Time Tagger devices that you can use to run measurements with just a few clicks. Information on how to download and install the software and how to initiate a basic testing experiment can be found in the Getting Started section of the documentation. The purpose of this tutorial is to explore the capabilities of Time Tagger Lab in more detail and to cover the most common aspects of configuring and running measurements with it.
Selecting a device on the home screen
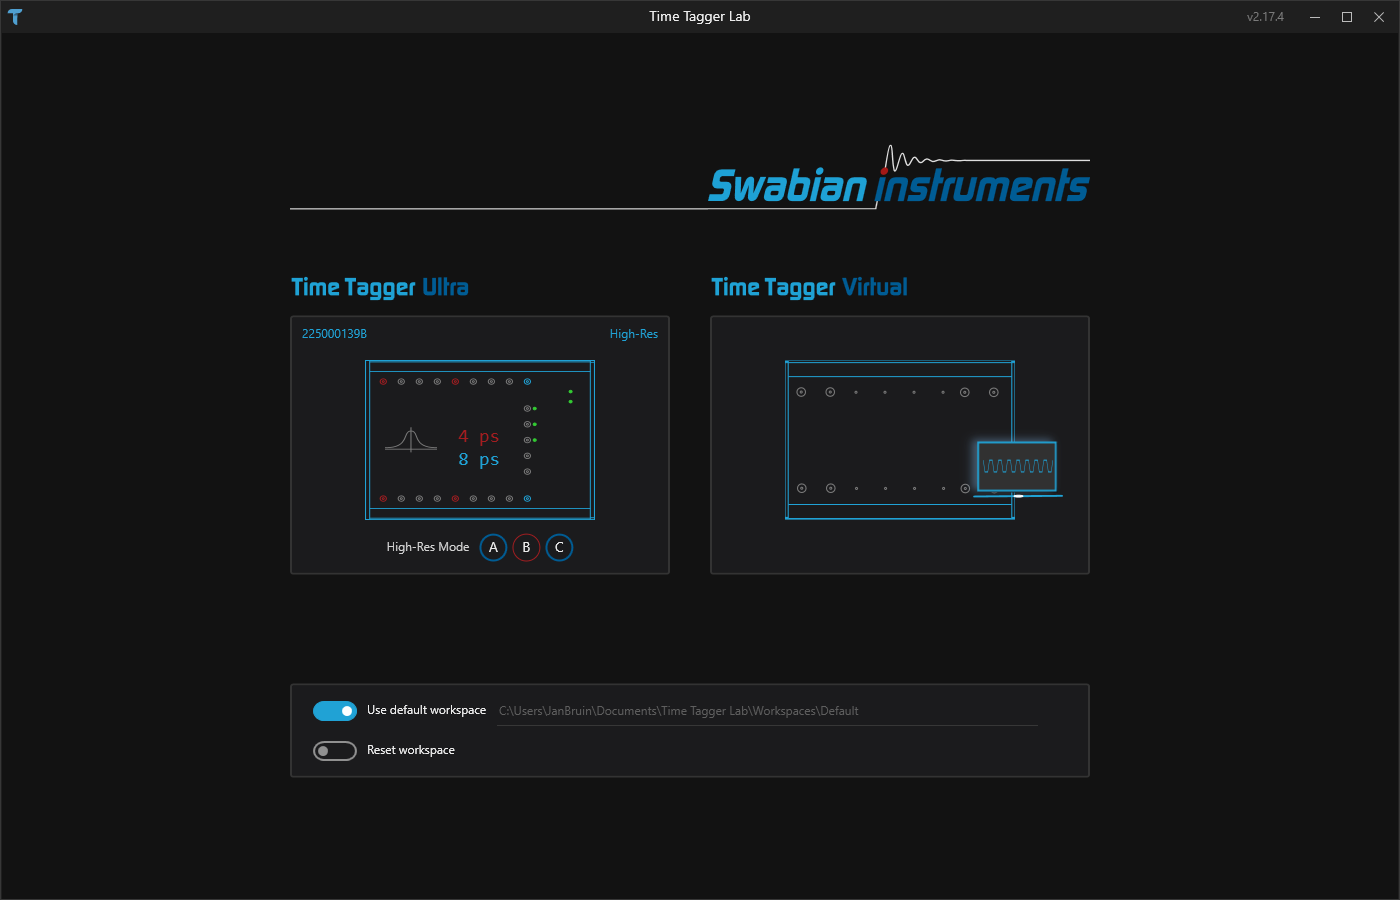
On the home screen of Time Tagger lab, you will see all Time Tagger devices that are attached to your computer. Each device can be identified by its serial number, shown in the top left of the corresponding card. If your Time Tagger is not listed here, it may be because it is in use by another program or not yet powered up.
Note
Time Tagger Ultra and Time Tagger X have a “HighRes” option to achieve improved jitter that can be updated over-the-air. If you want to operate in these modes, you should select them here before clicking on the card. If you are interested in this option and your device has not been configured appropriately, please contact our team at sales@swabianinstruments.com.
For the Time Tagger X only, there is an additional option to select input impedance, see: setInputImpedanceHigh().
At the bottom of the screen, the workspace menu allows you to select the folder in which your configuration and settings will be stored, as well as an option to overwrite your previous workspace to default values.
The card named Time Tagger Virtual allows you to experiment with the functionality of Time Tagger Lab without a physical Time Tagger, using only simulated signals.
Configuring input channels
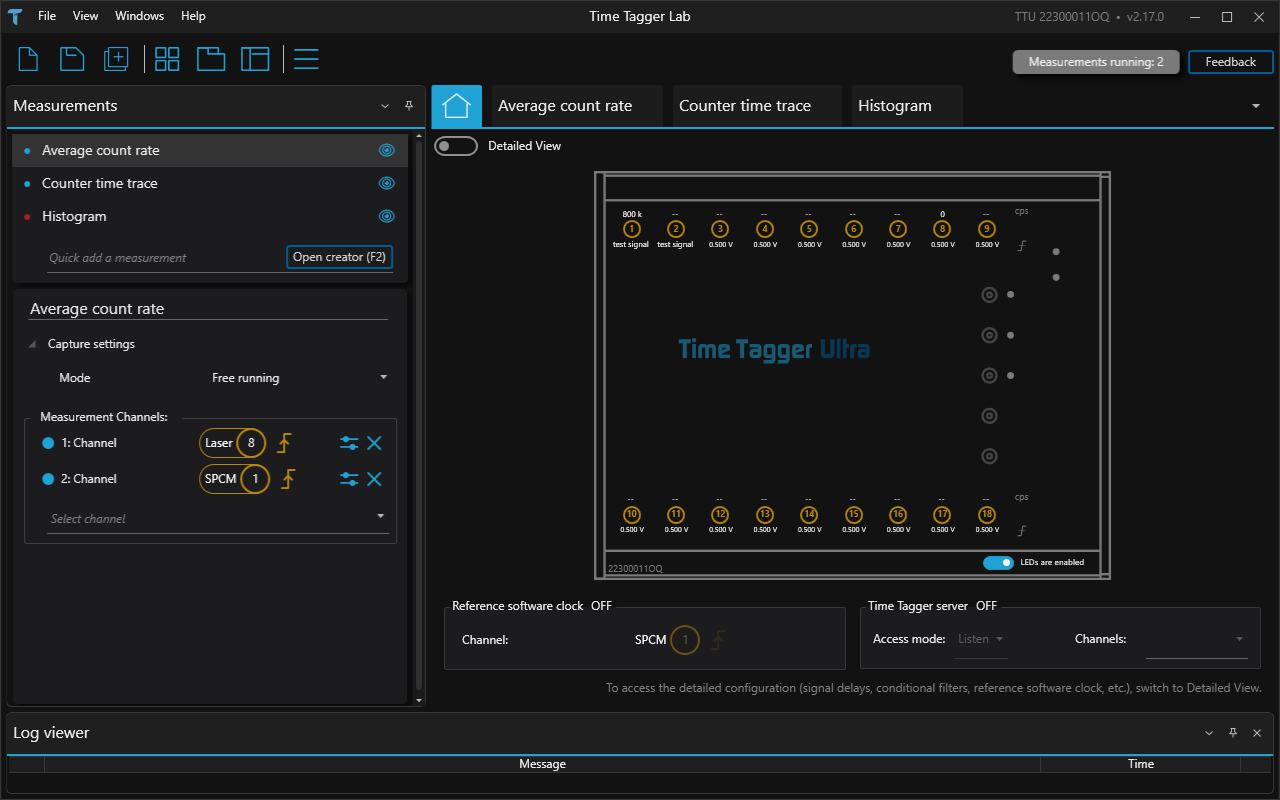
The first window that is shown is the device view. Here, you see a graphical representation of your Time Tagger with the available channels highlighted. The live count rate and trigger level are shown above and below each input, respectively. The trigger level can be adjusted with a slider that appears when hovering over the value. If you are using a Synchronizer, you can cycle through all synchronized Time Taggers using the arrow buttons to the right and left of the device.
Below the device view, you will see status indicators for the reference software clock and the time tagger server.
To access detailed options for device settings, and to configure the reference clock and/or server, use the slider in the top left corner to switch to Detailed View.
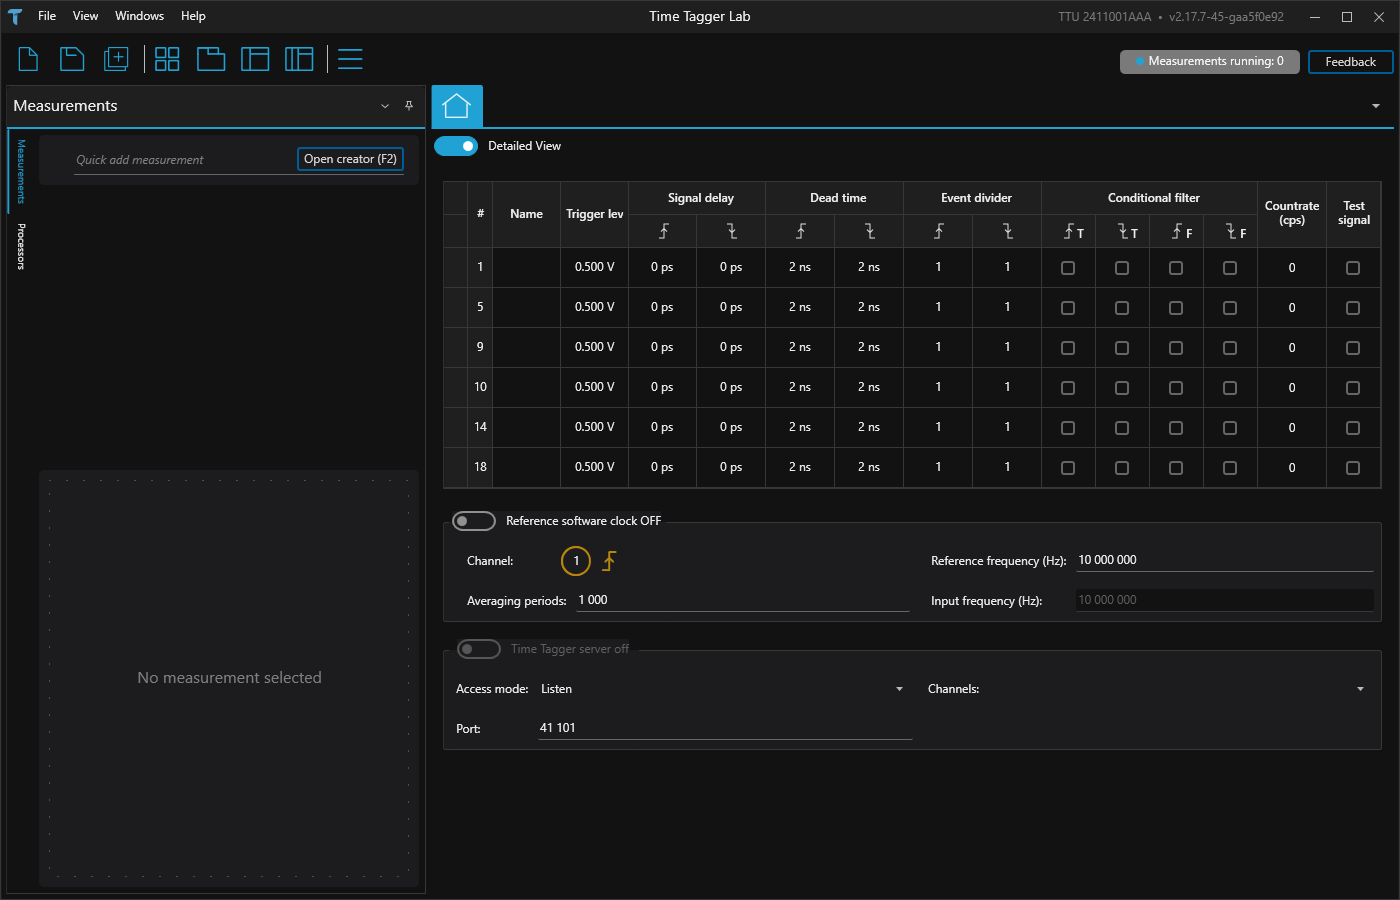
In the detailed view, all channel configurations are listed in a table. Most parameters may be applied separately to rising and falling edges and all channels are treated fully independently of one another. Optionally, channels can be assigned a name to make them easier to identify later. When tuning the channel parameters (e.g. Trigger level, Signal delay, Dead time, Event divider, Conditional filter), it can be very useful to monitor their influence on the displayed live count rate. These values are shown in a separate column near the right hand side of the table, in counts per second (“cps”, rising edge events only).
Trigger level
Adjusting the trigger level can help to maximize the signal to noise ratio of your measurement.
You can adjust the trigger level in 1 mV increments, see: setTriggerLevel().
The available range of trigger levels depends on the specific Time Tagger model, as listed in the Hardware section.
Often, the trigger level is set around half the maximum amplitude of the signal, as this is where the signal tends to be steepest.
Please refer to our knowledge base article on trigger levels for more details.
Signal delay
You can add an arbitrary delay to the signal with 1 ps resolution, see: setInputDelay().
The delay may be either positive or negative.
This setting can be used to offset or align signals in time at different inputs, e.g. to correct for different cable lengths.
For a more detailed discussion on the use of software and hardware delays, please refer to our knowledge base article on delay compensation.
Dead time
Because the dead time of the Time Tagger is often shorter than that of a detector, undesired signals (e.g. from afterpulsing) may sometimes be acquired as counts.
To prevent this, one can modify the dead time to each channel individually, see: setDeadtime().
The default value is the minimum dead time for the Time Tagger device model.
Event divider
When working with periodic signals with very high repetition rates (e.g. clocks or pulsed lasers), it may be necessary to reduce the rate of tags to prevent Overflows.
You can apply an event divider to the signal to divide down the rate of the signal by a factor of n, see: setEventDivider().
Conditional filter
The conditional filter can be configured by selecting one or more triggered (T) and one or more filtered (F) channels, see: setConditionalFilter() as well as the in-depth guide Conditional Filter.
Performing measurements
Measurements are listed on the left-hand panel of Time Tagger Lab.
To start a new measurement, either type the name of that measurement in the Quick add a measurement box, or open the wizard with the button Open Creator or by pressing F2.
The creator wizard lists all available measurements together with their descriptions and explanatory figures.
For a more detailed description of all supported measurements, please refer to the Measurement Classes section of the documentation.
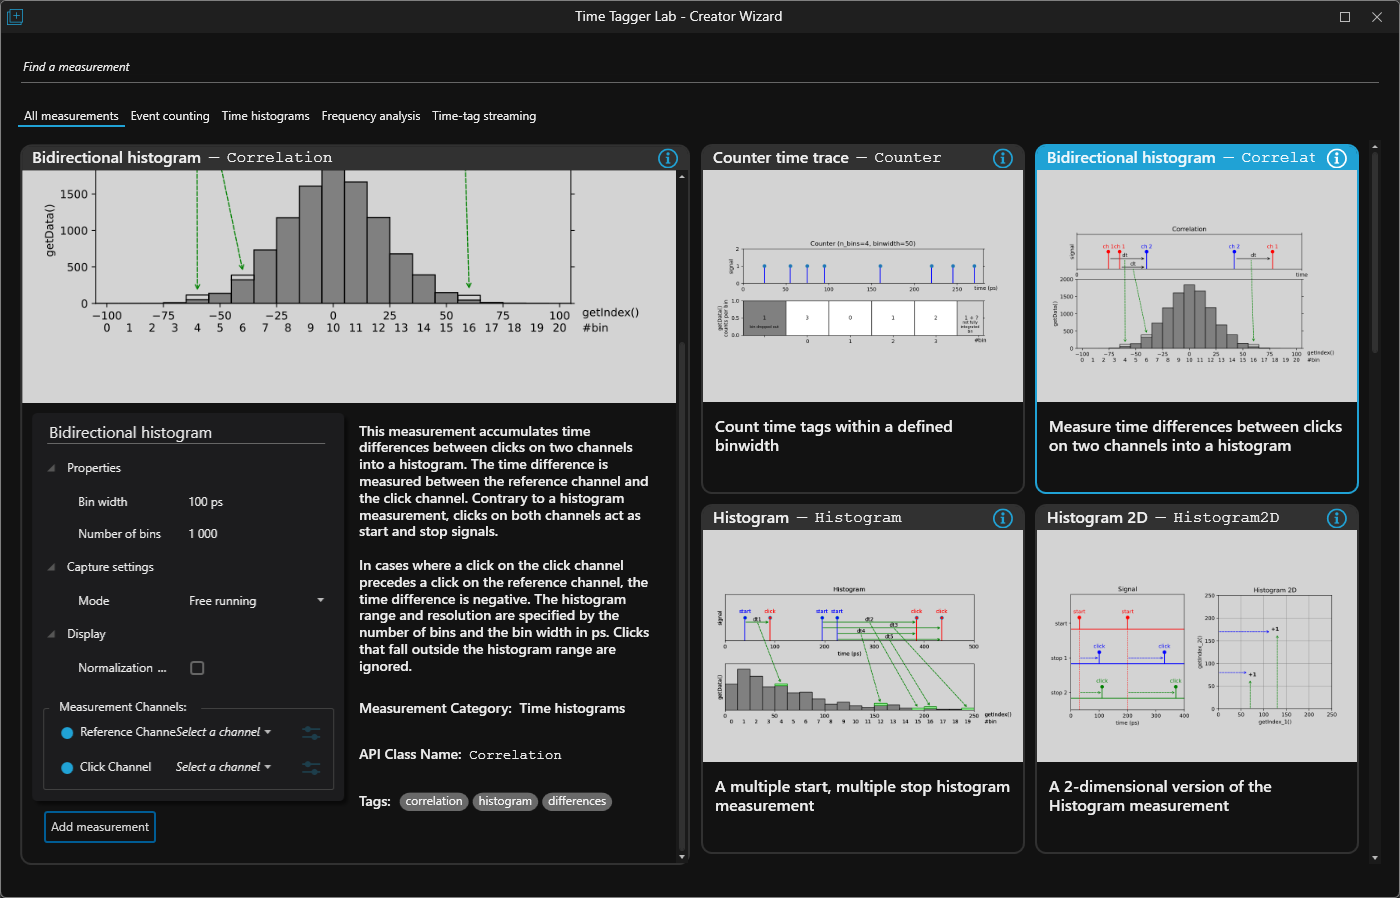
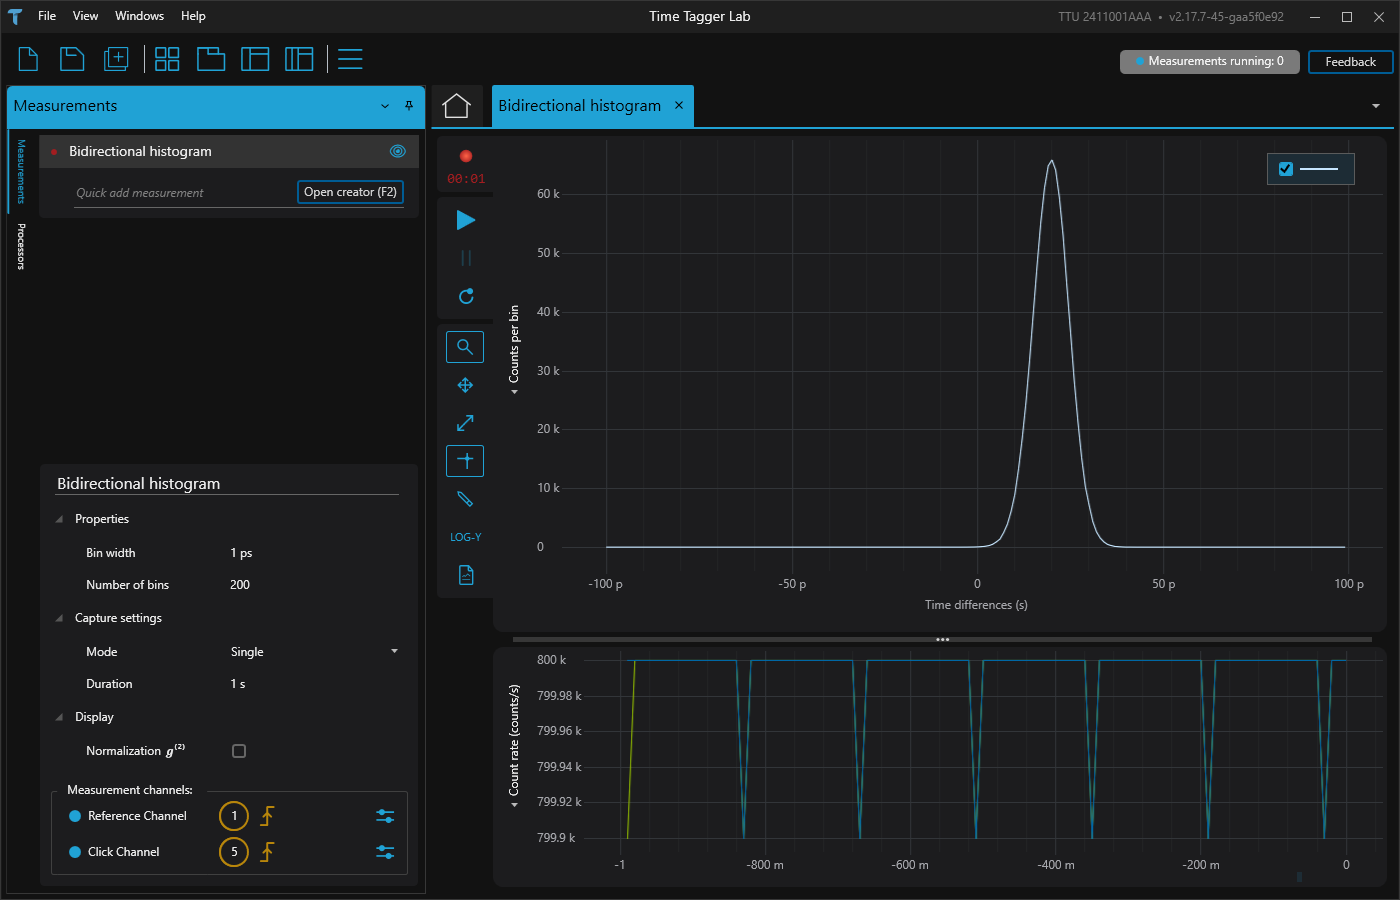
In the figure above, a Bidirectional Histogram measurement is selected within the creator wizard.
This measurement is typically used for performing second order correlation / photon antibunching experiments.
After adjusting the input parameters, the measurement can be added with the button Add measurement.
If any parameter needs to be adjusted later, it can be done easily after the measurement has started and whilst it is running.
If the input configuration is incomplete for a valid measurement, a warning will be displayed.
The measurement view
Once a measurement is added, it will appear as an item in the measurements list and the corresponding chart will appear under a new tab in the main window.
The main measurement controls start, stop and restart can be accessed in either location.
By default, measurement charts are organized as a horizontal list of tabs.
However, you can freely rearrange them by right-clicking on a tab and choosing float or New Horizontal / Vertical Document Group.
In particular on high-resolution monitors, this allows for displaying many measurements side-by-side with great flexibility.
Measurements list
The measurements list on the top left shows all configured measurements. Their corresponding charts can be hidden or shown by clicking the ‘eye’ button. Right-clicking on a measurement opens a menu to clone or delete it.
Chart view
The chart view on the right is a live display of the measurement data. Usually, it consists of two elements: a main chart above and an auxiliary chart below. Left of the main chart are the measurement controls, as well as zooming, panning, crosshair, data marker and logarithmic axis controls. Zooming is performed by clicking and dragging a box over the chart. Double-click on the chart to revert to automatic zoom limits. The measurement control for exporting data is described in more detail under Saving measurement data.
Clicking on a legend checkbox toggles the visibility of that data series, and right-clicking the legend allows it to be moved to a different corner of the chart.
For most measurements, the auxiliary chart displays either the concurrent Counter or FrequencyCounter measurement of the measured input channels, which can be useful for monitoring purposes.
Switch between these two measurements by clicking on the y-axis label of the auxiliary chart.
Properties
Time Tagger Lab allows for on-the-fly changes to the inputs of your measurements in the corresponding properties box in the bottom-left corner of the screen. Changing Display properties only affects how the chart displays the data and does not interrupt the measurement. Changing other properties typically causes the measurement to restart, with the new settings in place. The Capture settings determine whether the measurement will run for a fixed amount of time (Single), repeatedly for a fixed time (Repeating) or indefinitely (Free running).
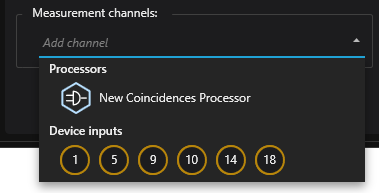
Processors and virtual channels
Virtual Channels have been partially implemented in Time Tagger Lab since software version 2.18.0.
They are software-defined channels which behave like physical measurement channels, but are created by processors such as Coincidences, GatedChannel or DelayedChannel.
Processors are created similarly to measurements, the main difference being that their output is not a chart but a (named) virtual channel which can be used as an input for measurements or other virtual channels.
The icons used to represent physical channels are numbers within golden circles, whereas processors are represented by white hexagons around a stylized AND gate.
The tab for creating virtual channels is shown on the left-hand side of the screen and can be switched with the measurements tab.
If it is convenient to show both the virtual channels and measurements side by side, the view can be switched with the layout buttons in the view menu.
After a virtual channel is created, it will be listed under every Select/Add a channel control, alongside the physical input channels.
Processor tips and tricks
Processors can be a very powerful tool to analyze your data, but using them may involve complicated configuration interdependencies. To help prevent broken dependencies and other pitfalls, Time Tagger Lab restricts some of the choices you can make when creating and deleting processors. When editing the configuration of a processor, any measurements that use its virtual channels as inputs must be paused. In addition, the inputs to that processor may only include virtual channels belonging to previously created processors. When deleting processors or virtual channels, you will receive a warning listing all the dependent processors and measurements whose configuration will change due to the removal of the object.
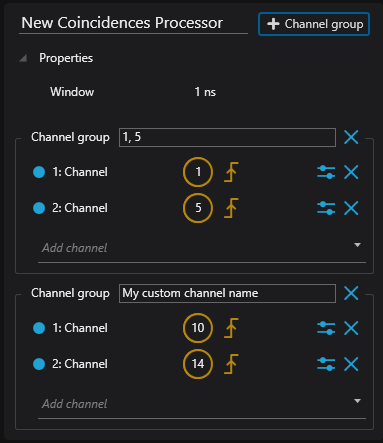
When configuring multiple Coincidences channels with the same coincidence window, it is generally recommended to combine them in the same processor.
The reason for this is that the computational performance is much higher than for many single-channel Coincidences processors.
Virtual channel naming
All processors must have a unique name, and Time Tagger Lab assigns a default one which you may overwrite freely to make it more descriptive.
For processors with only a single output, such as DelayedChannel, the virtual channel name matches the processor name.
For processors with multiple possible outputs, such as Coincidences, each virtual channel must have its own name.
Again, Time Tagger Lab will assign default names which you are free to change.
When selecting these virtual channels as inputs to a measurement or another processor, the channel name is selected from a drop-down menu.
Saving measurement data
These are the two ways of saving measurement data to file within Time Tagger Lab using the relevant chart control.
Note
If you want to save raw time tags to file from Time Tagger Lab use a Time tag file writer measurement instead, see also: FileWriter.
Export data / trace data
Export data / trace data saves either the main or auxiliary chart data series as a tab-separated text file.
The first line of the file contains descriptive header data.
Export chart
Save chart as saves the main measurement chart as a PNG image.
Reference clock
The reference clock can be configured within the detailed device view. The reference clock provides a powerful software-defined tool to rescale the time base of the measured tags to an external clock. Select the input to be used for the clock channel, input the clock frequency and start and stop the reference clock using the toggle button.
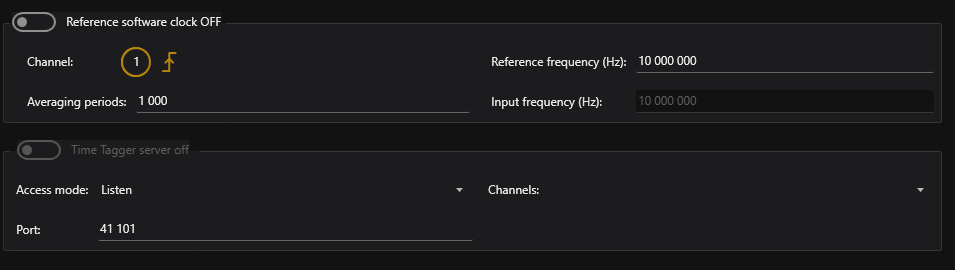
Network server
From the detailed device view, a network server can be configured and enabled.
For a detailed discussion of Time Tagger Network, see The TimeTaggerNetwork class.
Select the appropriate server AccessMode: Listen, Control, or SynchronousControl.
Start and stop the server using the toggle button.
Troubleshooting
Time Tagger Lab has several ways of displaying errors. Typically, these are not critical and a normal part of using the hardware. Understanding error messages helps to troubleshoot possible issues with your measurements.
Note
To reach out to Swabian Instruments user support, please contact us at support@swabianinstruments.com
Overflows
A common error is Overflows, which occur when the tag rate is persistently above the hardware limits. For reference, the USB 2.0 interface of the Time Tagger 20 is capable of 9 MTags/s, and the USB 3.0 interface of the Time Tagger Ultra and Time Tagger X can perform at 90 MTags/s. However, the actual rate you can achieve also depends on the CPU of the PC the Time Tagger is attached to. For a more detailed discussion of this topic, please refer to our knowledge base article on rate limits.
To avoid overflows, consider the use of Event divider or Conditional filter to reduce the streamed data rate.
Log warning messages
Time Tagger Lab reports warning messages from the backend engine in the log viewer.
Example messages would be a Time Tagger USB disconnection event, or a network client connecting to the local server.
If the log viewer is not currently visible, you can open it with the menu item Show Log Viewer under Windows.
Right-clicking anywhere within the log viewer gives the option to clear the log, or to suppress all existing alarms.