
Elevating Echo DLS Measurements using Swabian Instrument’s Time Taggers
by Tanushree Gollapalli | on 30 July 2026
The custom-made DLS setup in the Physical Chemistry department at the University of Stuttgart uses a Time Tagger 20 as a correlator for data acquisition in their 3D-DLS and DDLS experiments. It highlights the unique capabilities of Time Tagger as a digital correlator, able to reproduce data compatible with the already existing software structure, help with the device alignment, and also perform classic DLS experiments.
How the Swabian Instruments’ Time Taggers elevate Echo DLS Measurements at the University of Stuttgart
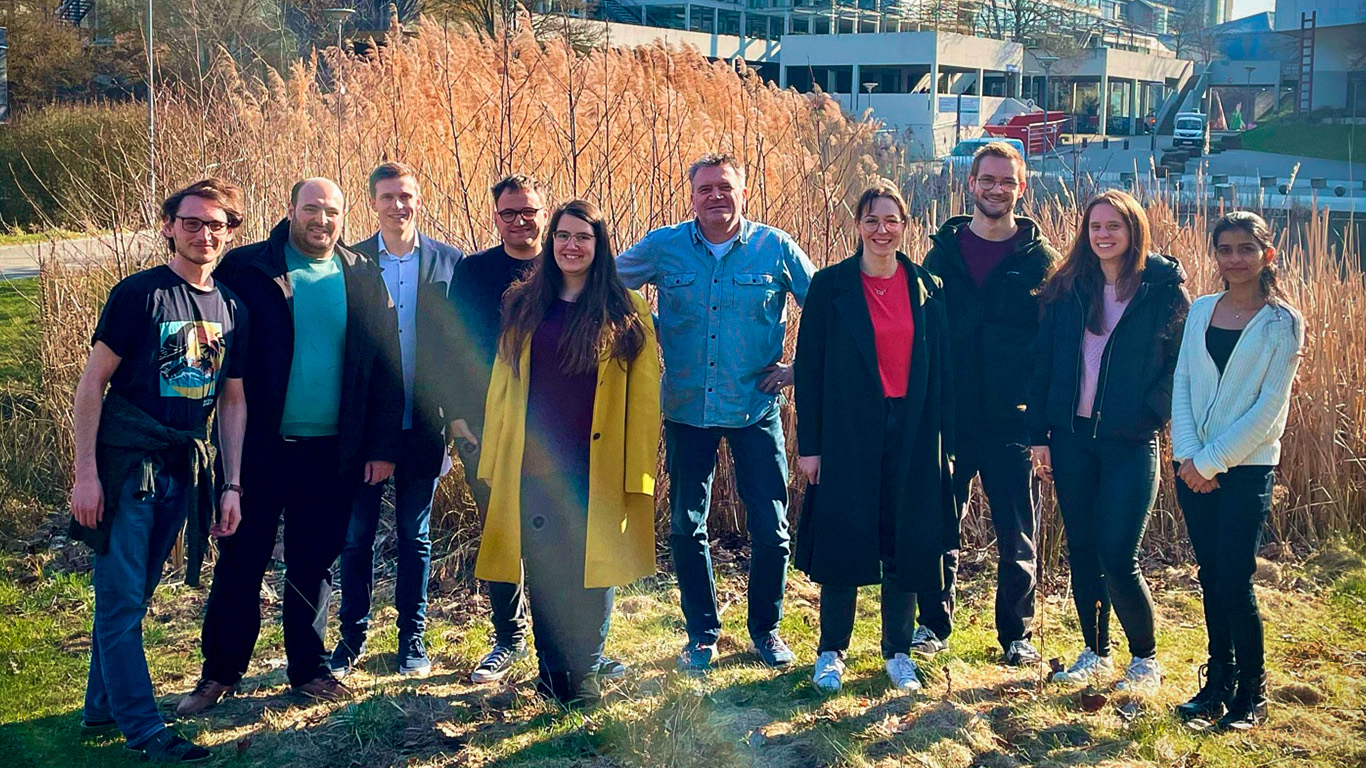
Florian Trummer is a final-year PhD student in the Physical Chemistry department at the University of Stuttgart, working under the supervision of Prof. Thomas Sottmann. His research centers on the application of scattering techniques to investigate the structure and dynamics of soft matter systems. To study these systems at the molecular level, Florian’s group uses a combination of static and dynamic techniques, including Small-Angle X-ray Scattering (SAXS), Small-Angle Neutron Scattering (SANS), and Dynamic Light Scattering (DLS). Florian is also a member of the Marie Skłodowska-Curie research network MultiSMART, a structural network focused primarily on gels, which reflects the group’s particular interest in non-ergodic and arrested-state soft matter systems. Central to his most demanding measurements is Swabian Instruments’ Time Tagger 20, which has become the data-acquisition backbone of a custom-built echo DLS spectrometer.
Why is Standard Dynamic Light Scattering Not Sufficient for These Systems?
Dynamic Light Scattering in its standard form relies on a fundamental assumption: that the sample is ergodic and explores all accessible configurations over the measurement time, making time- and ensemble-averaged correlation functions equivalent. Many soft matter systems of scientific and practical interest violate this assumption. These non-ergodic, spatially arrested systems yield configuration-dependent correlation functions when measured from a fixed sample position, making the extraction of physically meaningful relaxation rates unreliable without additional steps1.
A second, independent challenge arises in turbid or concentrated samples, where multiply scattered photons contaminate the measured correlation function. In standard single-beam DLS, multiple scattering distorts the measured relaxation time and shifts apparent size distributions in a way that cannot easily be corrected in post-processing.
Florian’s group addresses both challenges using two complementary techniques implemented in their custom spectrometer:
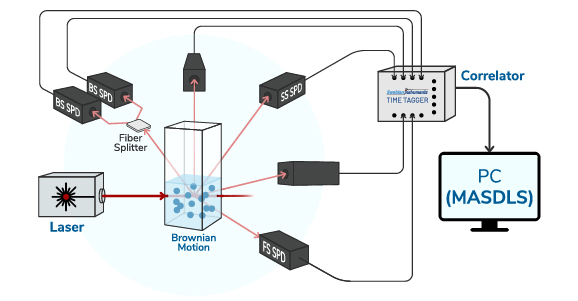
3D cross-correlation DLS suppresses multiple scattering from turbid samples by using two detector arms in a specific geometry so that only singly scattered photons are correlated. This enables measurement of samples that would otherwise scatter light too strongly for standard DLS to handle 2 3 4.
Echo DLS addresses non-ergodicity directly. The sample is continuously rotated in the laser beam with very high mechanical precision. Because the sample returns to exactly the same physical position after each full revolution, the same speckle pattern recurs periodically, producing a characteristic peak, an echo, in the correlation function. By analyzing this echo signal over extended measurement times, the group can determine the correct ensemble-averaged relaxation rate, even for stiff, non-ergodic systems 1 5 4.
Fitting a New Instrument Into an Established Workflow
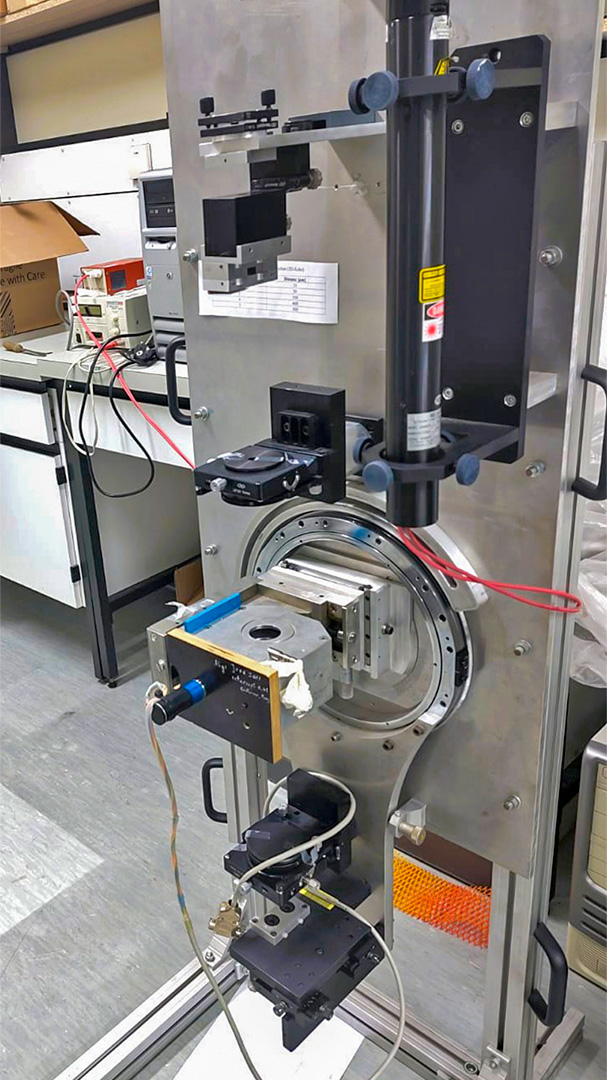
Florian’s group operates a custom setup4 that includes a precision motor, a flat bearing, a thermal jacket, lenses, beam splitters, PMTs, and a spectrometer, all built at the University of Graz, where he studied previously. When the setup was moved to Stuttgart, the team needed a timing solution that could realize the limitations of the old setup and be compatible with the existing software architecture.
The Time Tagger 20 was integrated to reconstruct the photon time stream in a binary format compatible with the old echo-correlation software. This allowed the entire downstream analysis pipeline to be preserved without modification. Beyond data acquisition, the Time Tagger’s graphical user interface (GUI) also became a practical tool for instrument alignment and, in some cases, for running standard DLS measurements. The flexibility to switch between GUI-based quick checks and full programmatic control via the API meant the instrument could serve multiple roles in the lab without requiring a dedicated operator for each use case.
It was very handy that we could use the Time Tagger 20 to recreate this output format in a way that it would fit the original software.
— Florian Trummer, University of Stuttgart
What This Enables: Measuring Non-Ergodic and Turbid Systems
With this setup in place, the group can characterize soft matter systems, including gels, concentrated colloidal suspensions, and other non-ergodic or highly scattering samples that lie beyond the reach of conventional DLS. Having the full photon stream available for post-processing means the team can revisit raw data, test alternative correlation and fitting approaches, and refine results without repeating experiments. Publications based on echo DLS data collected with this setup are currently in preparation.
Related Topics
Dynamic Light Scattering (DLS) Particle Size Analysis
Next-generation multi-angle DLS turnkey design with built-in consistency checks, raw photon access, and intelligent spike filtering for fast, reliable particle sizing.
Time Tagger Series
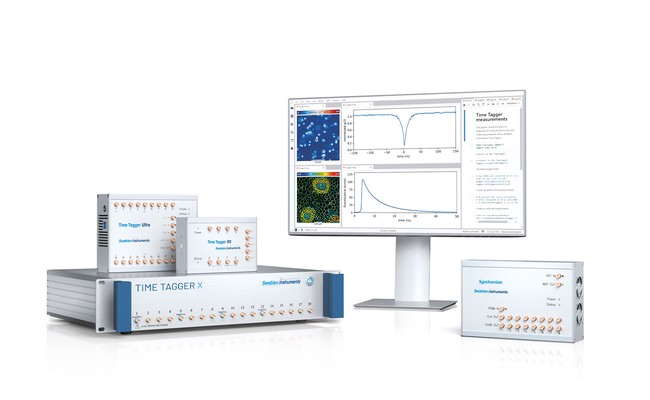
The Time Tagger Series provides endless capabilities for single-photon counting and you unleash them with no efforts.
References
Pusey, P.N. & van Megen, W. (1989). “Dynamic light scattering by non-ergodic media.” Physica A: Statistical Mechanics and its Applications, 157(2), 705–741. https://doi.org/10.1016/0378-4371(89)90063-0 ↩︎ ↩︎
Schätzel, K. (1991). “Suppression of multiple-scattering by photon cross-correlation techniques.” Journal of Modern Optics, 38(9), 1849–1865. https://doi.org/10.1080/09500349114551951 ↩︎
Urban, C. & Schurtenberger, P. (1998). “Characterization of turbid colloidal suspensions using light scattering techniques combined with cross-correlation methods.” Journal of Colloid and Interface Science, 207(1), 150–158. https://doi.org/10.1006/jcis.1998.5769 ↩︎
Medebach, M., Freiberger, N. & Glatter, O. (2008). “Dynamic light scattering in turbid nonergodic media.” Review of Scientific Instruments, 79(7), 073907. https://doi.org/10.1063/1.2947756 ↩︎ ↩︎ ↩︎
Schärtl, W. (2007). Light Scattering from Polymer Solutions and Nanoparticle Dispersions. Springer, Berlin.http://link.springer.com/book/10.1007/978-3-540-71951-9 ↩︎