| on 12 December 2025
Time Tagger Software v2.20 is now available. This release focuses on expanded capabilities for the Time Tagger Lab GUI, improved workflows for networking applications, new processors for creating software-defined virtual channels, and additional measurements.
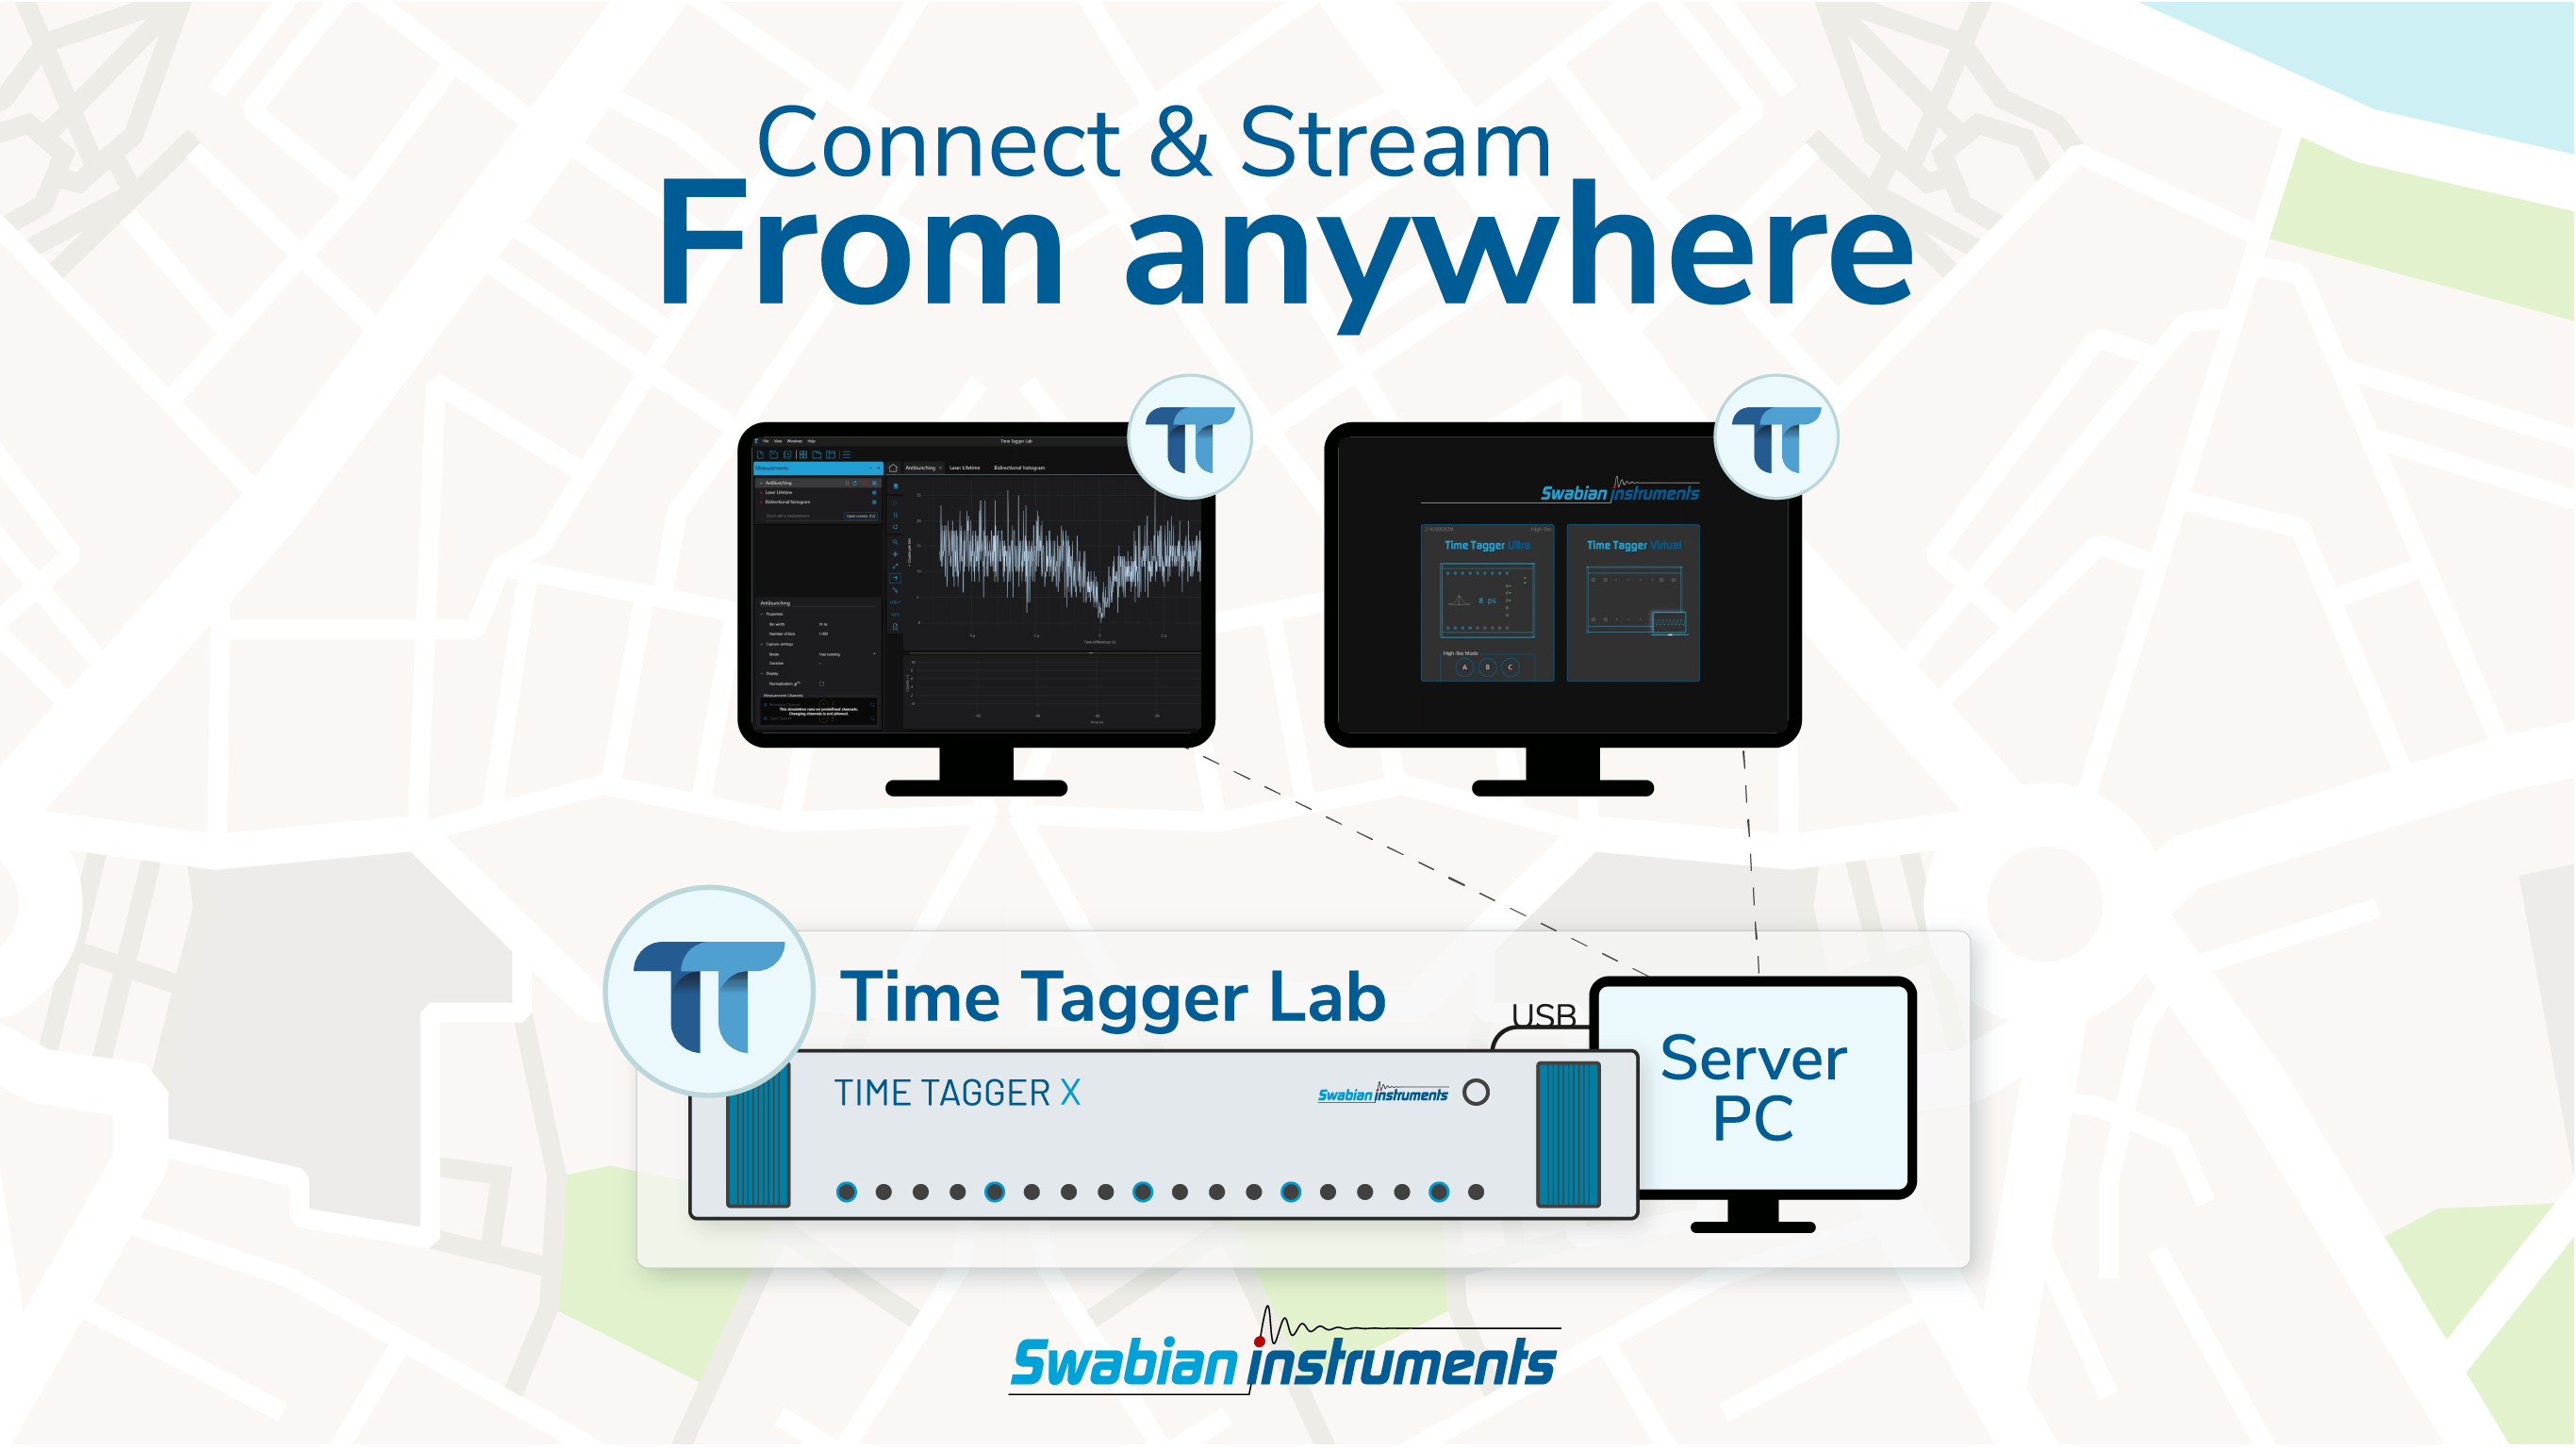
Time Tagger Lab in v2.20 now introduces full Network Client support, including for merging streams from multiple servers. Although previously available in the Time Tagger API, users can now connect to one or multiple Time Tagger servers using the graphical user interface, and operate their devices from anywhere on the network.
Time tags are streamed over USB to the server PC, then streamed from the server to the client over the network. This functionality is particularly suitable for experiments that require physical separation from their experimental set-up, who want to share a single Time Tagger between multiple users simultaneously, or who want to simultaneously merge the measurements from different time taggers in geographically remote locations.
Relevant applications are in optics, quantum communication, and educational settings. Further use cases include real-time merging of remote data sources such as for data server synchronization, quantum key distribution or telescope arrays.
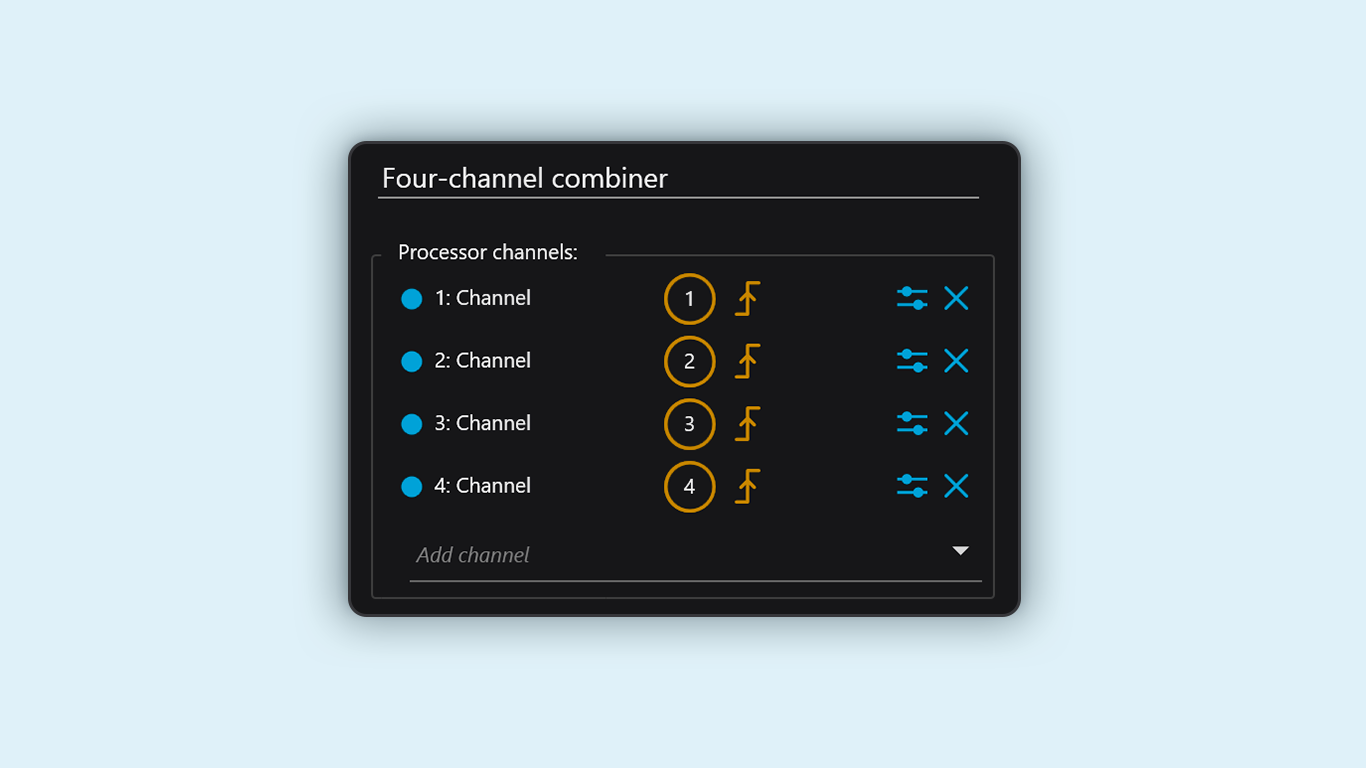
With the Combiner Virtual Channel, users can merge two or more physical or virtual channels into a single channel, allowing them to process the data as if it were acquired on a single input channel. This virtual channel is implementable on all active channels and allows for more powerful data analysis than previously possible. For instance, users can monitor the total count rate on a subset of channels by merging them into a Combiner Virtual Channel and running a count rate measurement.
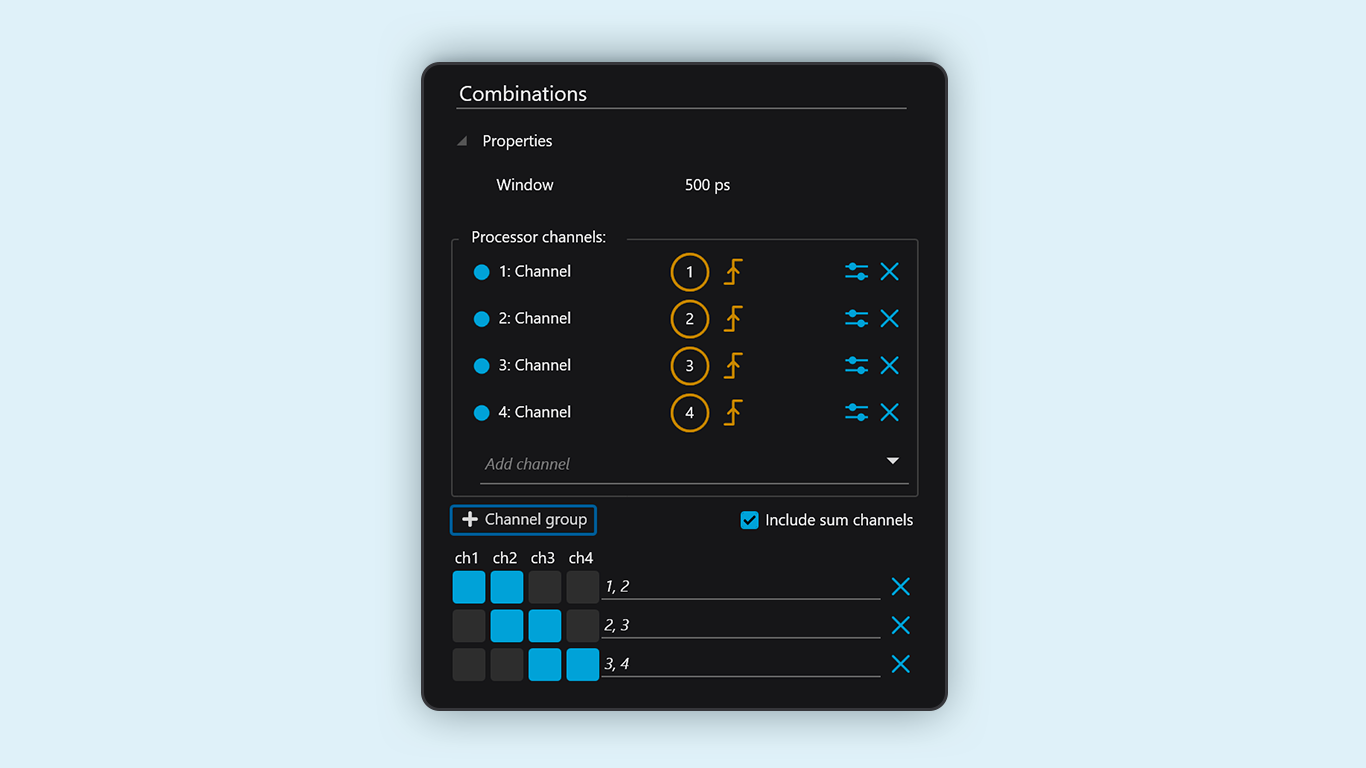
New to Time Tagger Lab, the Combinations Virtual Channel allows users to evaluate exclusive coincidences across up to 20 input channels. These virtual channels contain instances of coincident clicks on a specific subset of channels, with no coincident clicks on others, as defined by the user. The analysis of exclusive events is particularly useful for those working in quantum information and Photon Number Resolution (PNR).
While previously available in the backend, users can now run Phase Noise Analysis in the Time Tagger Lab. This software-defined measurement enables the estimation of the noise spectral density for periodic signals such as clocks and oscillators.
The Time Tagger timestamps zero crossings with picosecond precision, then locks the time tag stream to an external standard via a software PLL. Directly from the time tags, the software computes the single-sideband (SSB) L(f). The algorithm relies on Welch’s method to estimate the Power Spectral Density (PSD), and provides a phase noise estimator with spectral samples distributed quasi-logarithmically over frequency offset.
Optimised for applications that require low-noise oscillators, frequency metrology, and precision timing systems, this measurement specifically targets the timing and frequency space.
CorrelationPairs, HistogramCustomBinsDesigned for users’ ease, the CorrelationPairs Measurement creates a bidirectional histogram for all two-fold combinations or pairs of a list of selected channels with just one line of code, quickly and easily allowing for coincidence analysis across many channels.
The HistogramCustomBins measurement allows users to define custom bin edges, providing a fine adjustment of bin edges when every picosecond matters. This measurement is particularly advantageous for those using periodic pulsed lasers in Fluorescence Correlation Spectroscopy (FCS), since it provides laser pulse artifact-free correlation on all timescales.

This tutorial explains how to perform Fluorescence Correlation Spectroscopy (FCS) and advanced variants, such as Fluorescence Cross-Correlation Spectroscopy (FCCS), Pulsed Interleaved Excitation (PIE), and Raster Image Correlation Spectroscopy (RICS), using the Time Tagger hardware and software for data acquisition and live analysis.

The Time Tagger Python libraries will now be conveniently available under the package name Swabian-TimeTagger through PyPI on Linux. Our software tools have been integrated into the package manager, which offers an alternative way to install the Python libraries than through the official installer.
Any questions or feedback?
We would love to hear from you! Please send us a message at solutions@swabianinstruments.com.