
Biophysical Society Annual Meeting (BPS) 2026:Time-Resolved Measurements, FLIM, and DLS
作者 Yizhou Wang | 日期 08 May 2026
The Biophysical Society Annual Meeting (BPS) 2026, held from February 15–19 in San Francisco, California. Swabian Instruments showcased our fluorescence lifetime measurement demo and DLScat system to researchers working in biophysics.
The Biophysical Society Annual Meeting (BPS) is an annual meeting with an intrinsic, dynamic, multi-scale nature of the biophysics field. The program included verticals such as membrane transport and calcium signaling, as well as the biophysics of immunity, cancer, and protein design. As the Swabian Instruments team continues to expand the scope of applications targeted to support scientific research, we decided to attend BPS for the first time.
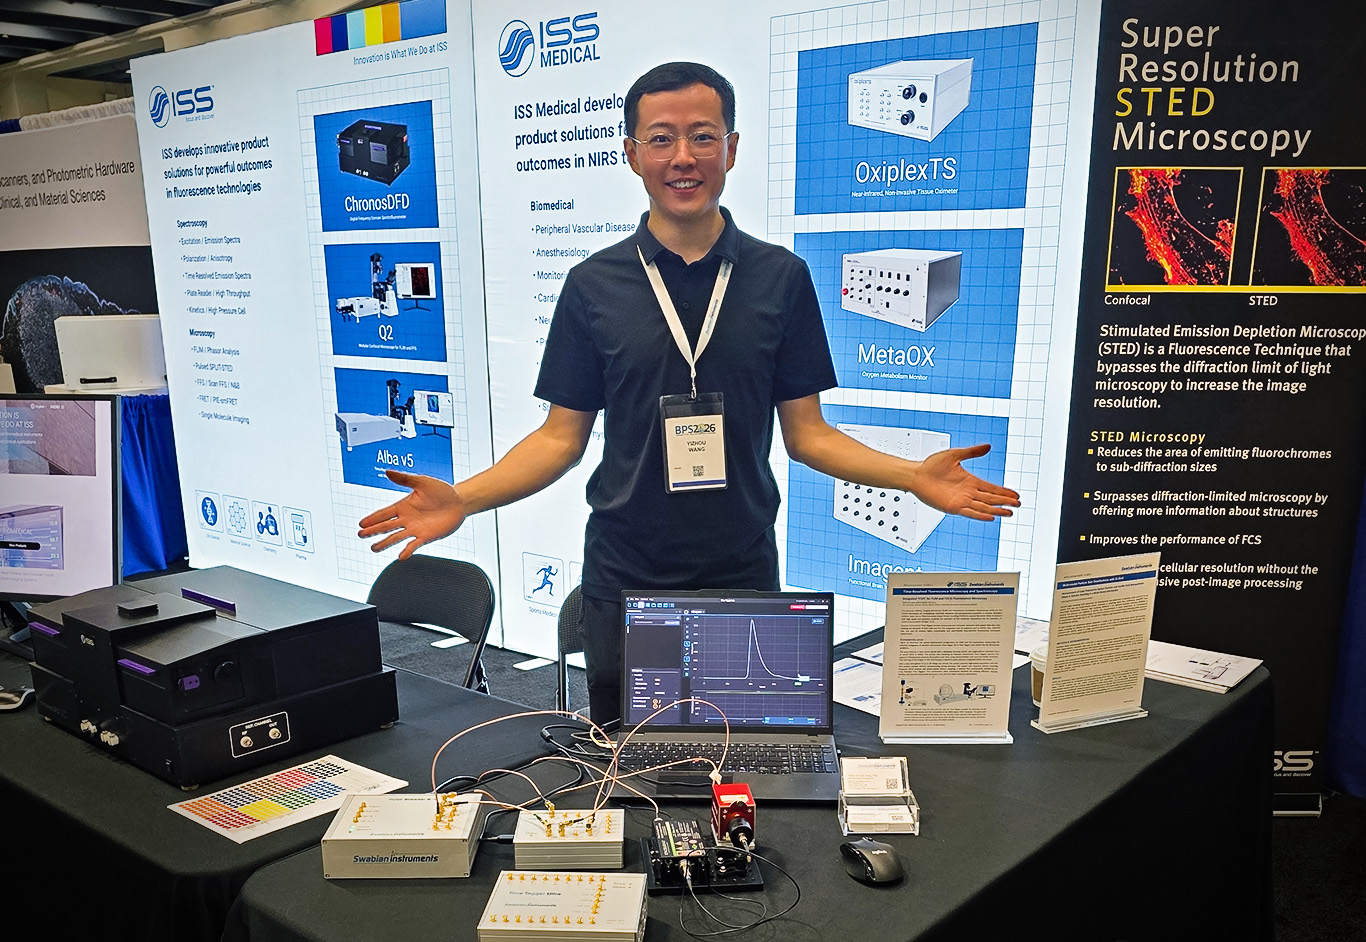
Swabian Instruments’ Ongoing Collaboration with ISS Inc.
At the Swabian Instruments booth, visitors were particularly interested in how the Time Taggers enable precise detection and analysis of photon arrival times. These capabilities are essential for a wide range of experiments in fluorescence lifetime analysis, correlation experiments, and time-resolved spectroscopy. Together with ISS Inc., whose instrumentation supports advanced fluorescence and time-resolved spectroscopy research, we demonstrated how to integrate optical measurement platforms and high-performance timing electronics into a practical workflow. In this collaboration, ISS brings expertise in spectroscopy platforms, while our Time Tagger provides the timing precision and flexible data analysis needed to capture photon dynamics at high temporal resolution.
In addition, the DLScat system generated strong interest among conference attendees. DLScat measures particle size in real time using multi-angle dynamic light scattering (DLS), enabling researchers to observe how particle populations evolve over time. For many scientists studying nanoscale biological assemblies, the ability to capture dynamic particle size distributions in real time provides valuable insight into processes such as molecular assembly, aggregation, and condensate formation. The ability to analyze kinetics is particularly important to track changes in particle size and dynamics over time, opening new possibilities for studying evolving biological and soft-matter systems. These discussions highlighted a growing interest in tools that not only measure size, but also help researchers better understand dynamic processes as they happen.
Particle Size Analysis as the Main Point of Discussion at the Poster Sessions
At BPS 2026, the poster sessions were among the most distinctive and valuable parts of scientific exchange and discussion. DLScat drew strong interest during the BPS poster sessions because it offered a new way to view dynamic biological and soft-matter systems. Its real-time, multi-angle dynamic light scattering capability led researchers to think beyond conventional DLS as a simple particle-sizing tool and sparked discussions about projects that are often considered difficult or even unsuitable for traditional particle size analysis systems. This included low-refractive-index-contrast samples, where weak scattering makes standard measurements challenging, as well as theoretical studies of protein dynamics that require experimental validation. For many researchers, the value of DLScat lies not only in its ability to measure size but also in its potential to reveal time-dependent processes, compare behavior across scattering angles, and provide experimental insight into systems that are otherwise hard to capture. These discussions often went beyond brief introductions and led to thoughtful exchanges about possible collaborations, making the poster sessions an especially valuable and successful part of the meeting.
Overall, BPS 2026 was a valuable opportunity to engage with researchers working on complex and dynamic biological systems. The depth of the conversations throughout the meeting highlighted a strong need for flexible measurement approaches that can better connect experimental capabilities with real scientific questions.
Related Content
Fluorescence Lifetime Flow Cytometry (FLFC)
Flow cytometry is a sheath-flow-based technique that uses laser excitation and fluorescence to evaluate the physical and chemical characteristics of cells or other suspended particles in a fluid stream
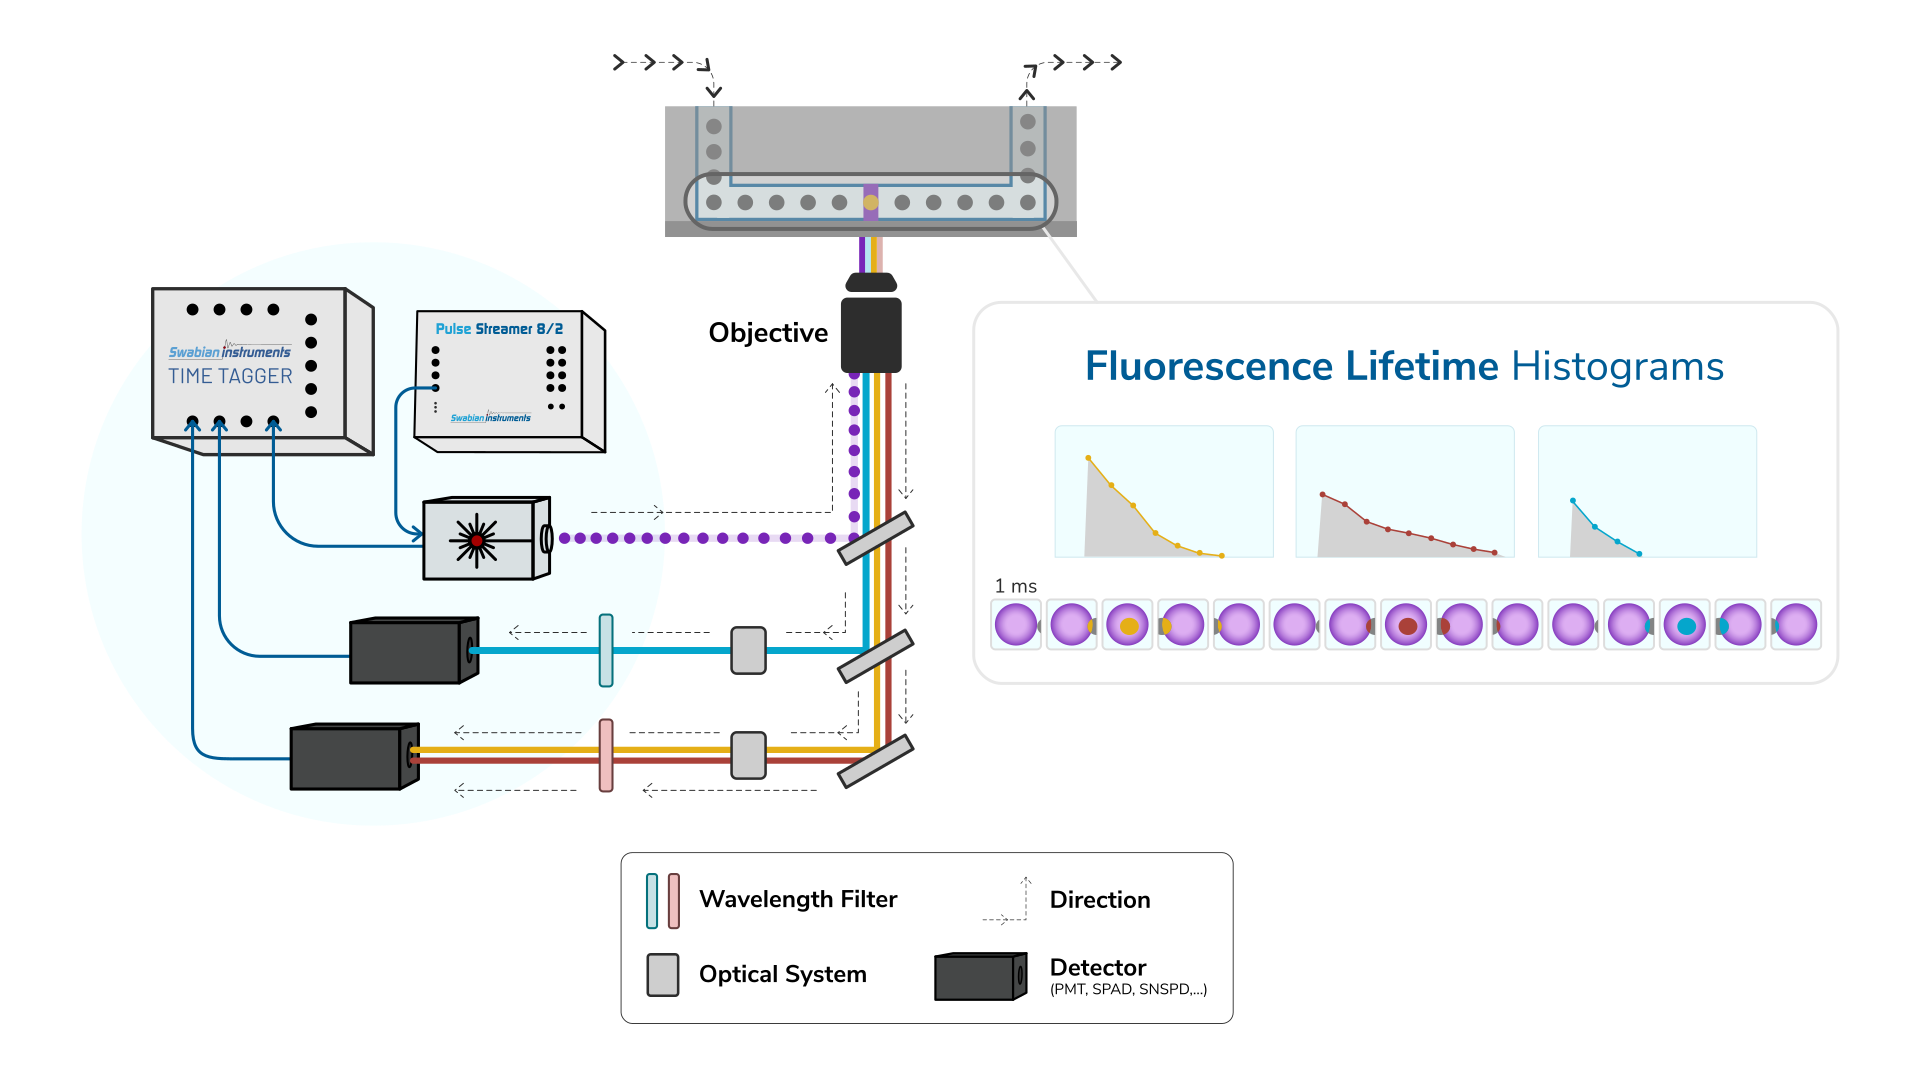
荧光寿命成像 (FLIM)
探索荧光寿命成像(FLIM)这一强大的成像技术,了解其如何以皮秒级精度绘制荧光寿命分布图。Swabian Instruments – 施瓦本仪器® Time Tagger 凭借先进的时间测量电子技术,支持光电倍增管(PMT)、单光子雪崩二极管(SPAD)和超导纳米线单光子探测器(SNSPD)等多种探测器,可实现高分辨率 FLIM 测量,助力前沿科研应用。
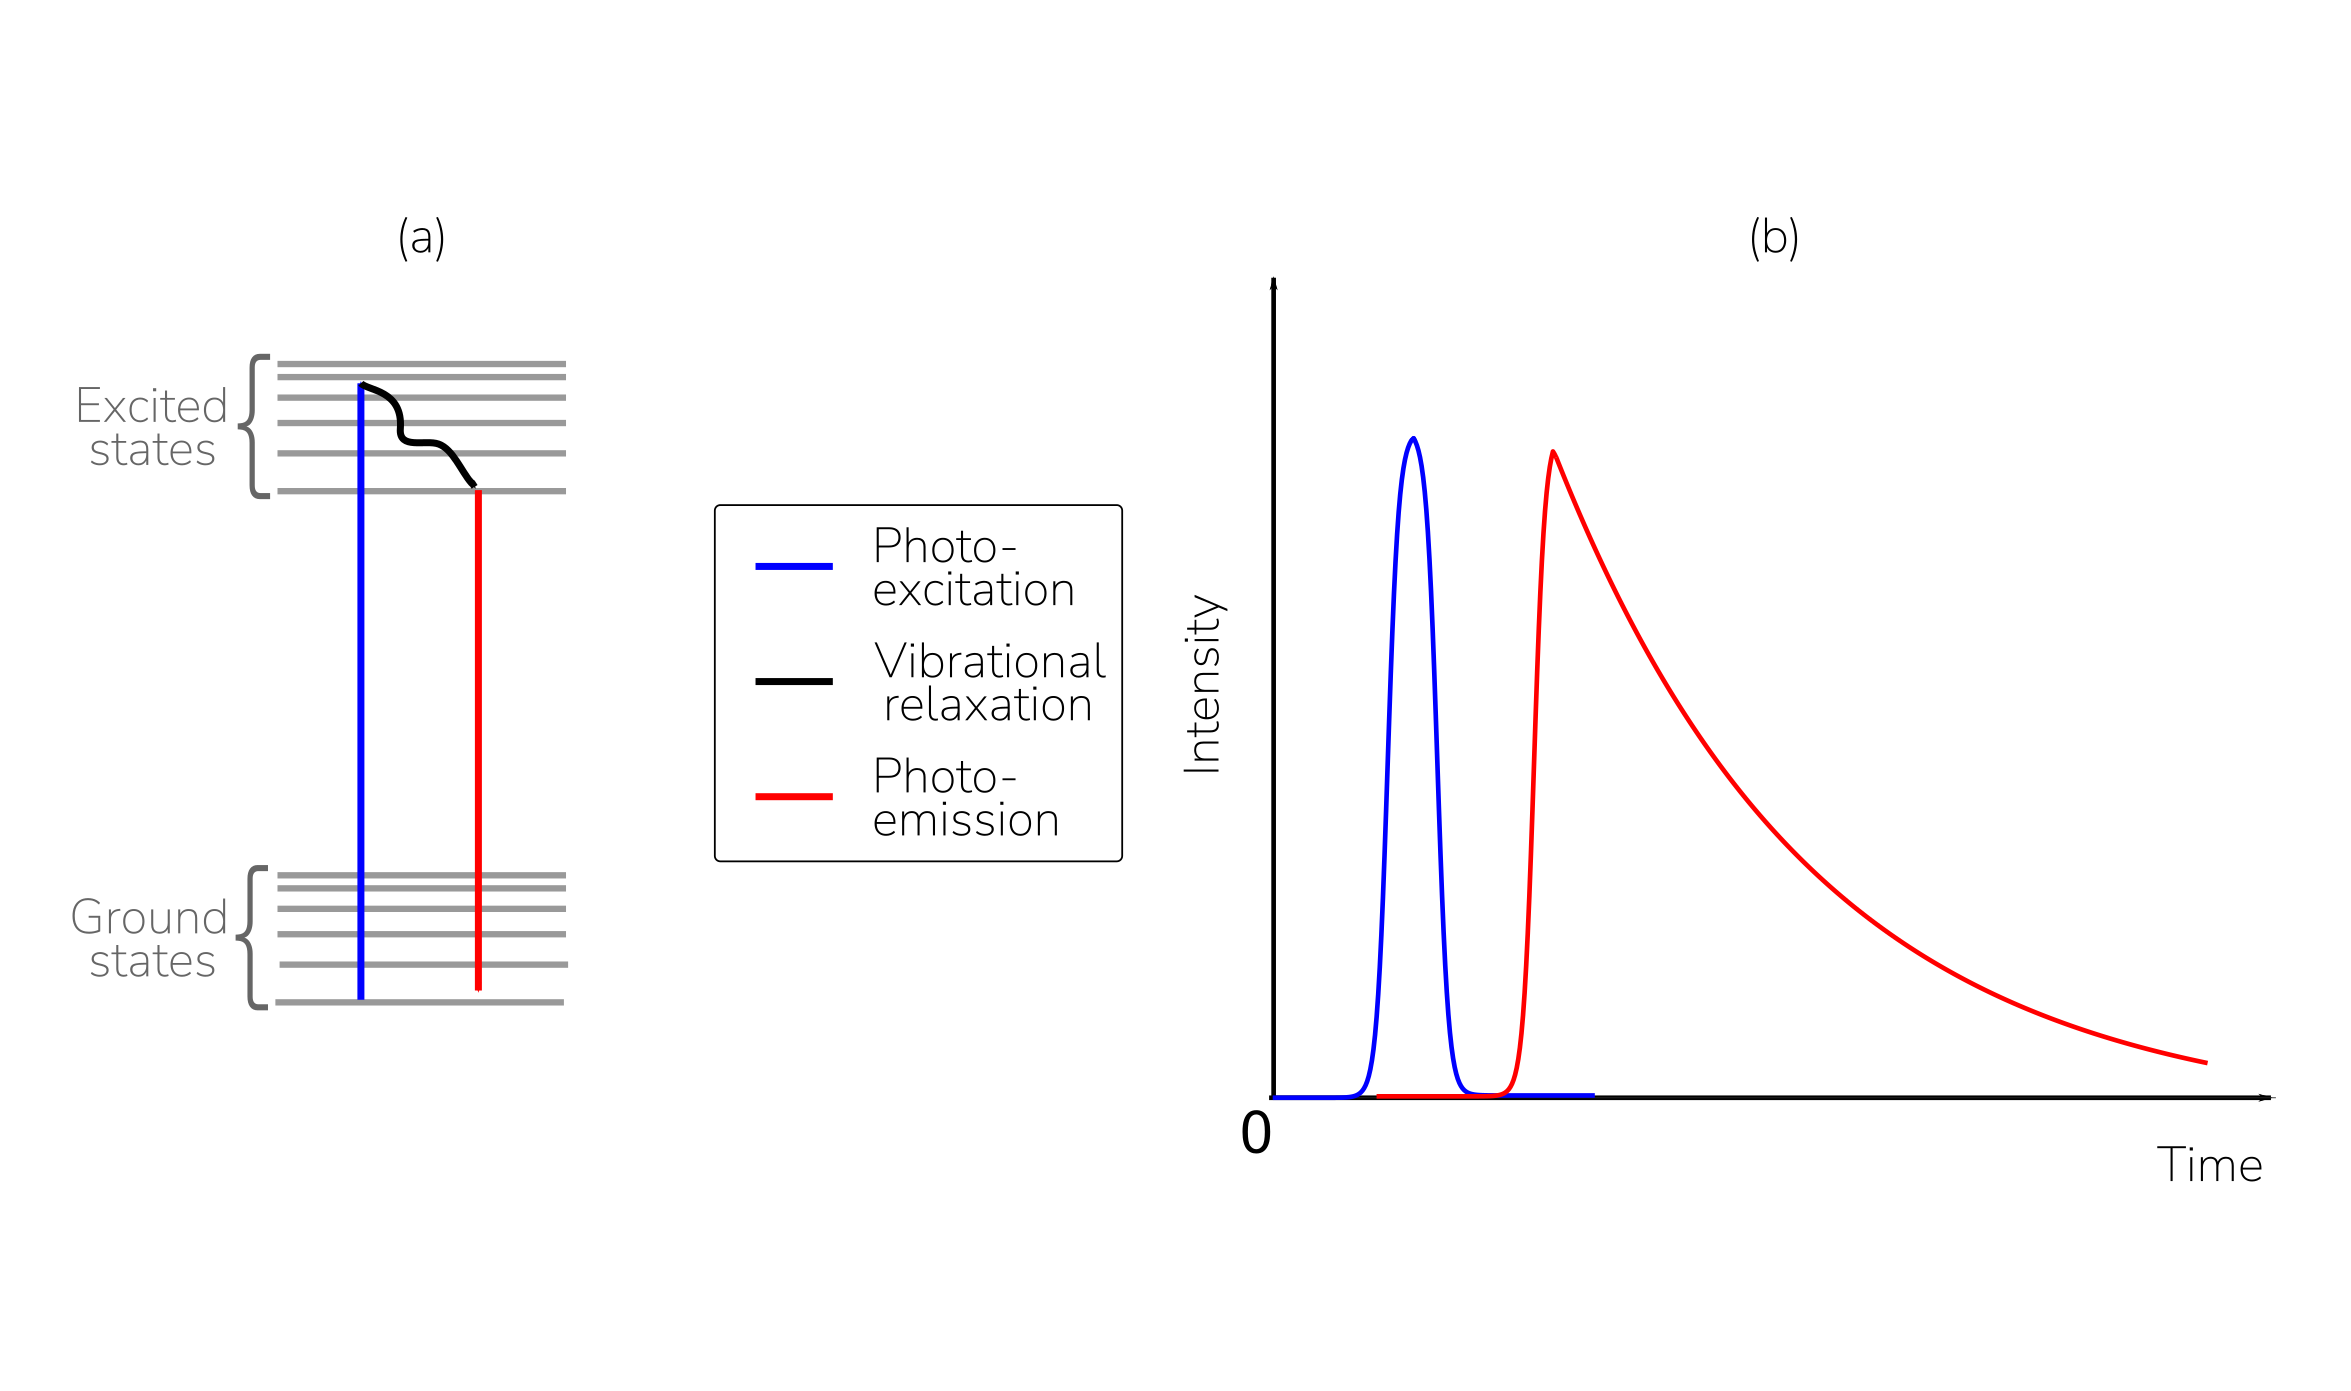
Time-Resolved Photoluminescence (TRPL)
Time-resolved photoluminescence (TRPL) is a powerful technique that measures the photoluminescence decay (emission lifetime) of materials after pulsed excitation, thereby probing their optical and electronic properties. By tracking how excited states relax back to the ground state, TRPL distinguishes between radiative and non-radiative pathways, yielding lifetimes that report on charge-carrier dynamics, trap/defect activity, and other loss mechanisms.
Dynamic Light Scattering (DLS) Particle Size Analysis
Next-generation multi-angle DLS turnkey design with built-in consistency checks, raw photon access, and intelligent spike filtering for fast, reliable particle sizing.
