
成像与光谱分析
Life science encompasses a broad spectrum of scientific research evaluating the complexities of biological systems. This field includes the study of living organisms (structure and function), their life processes (origin, growth, evolution, distribution), and their relationships to each other within an ecosystem and with their environments.
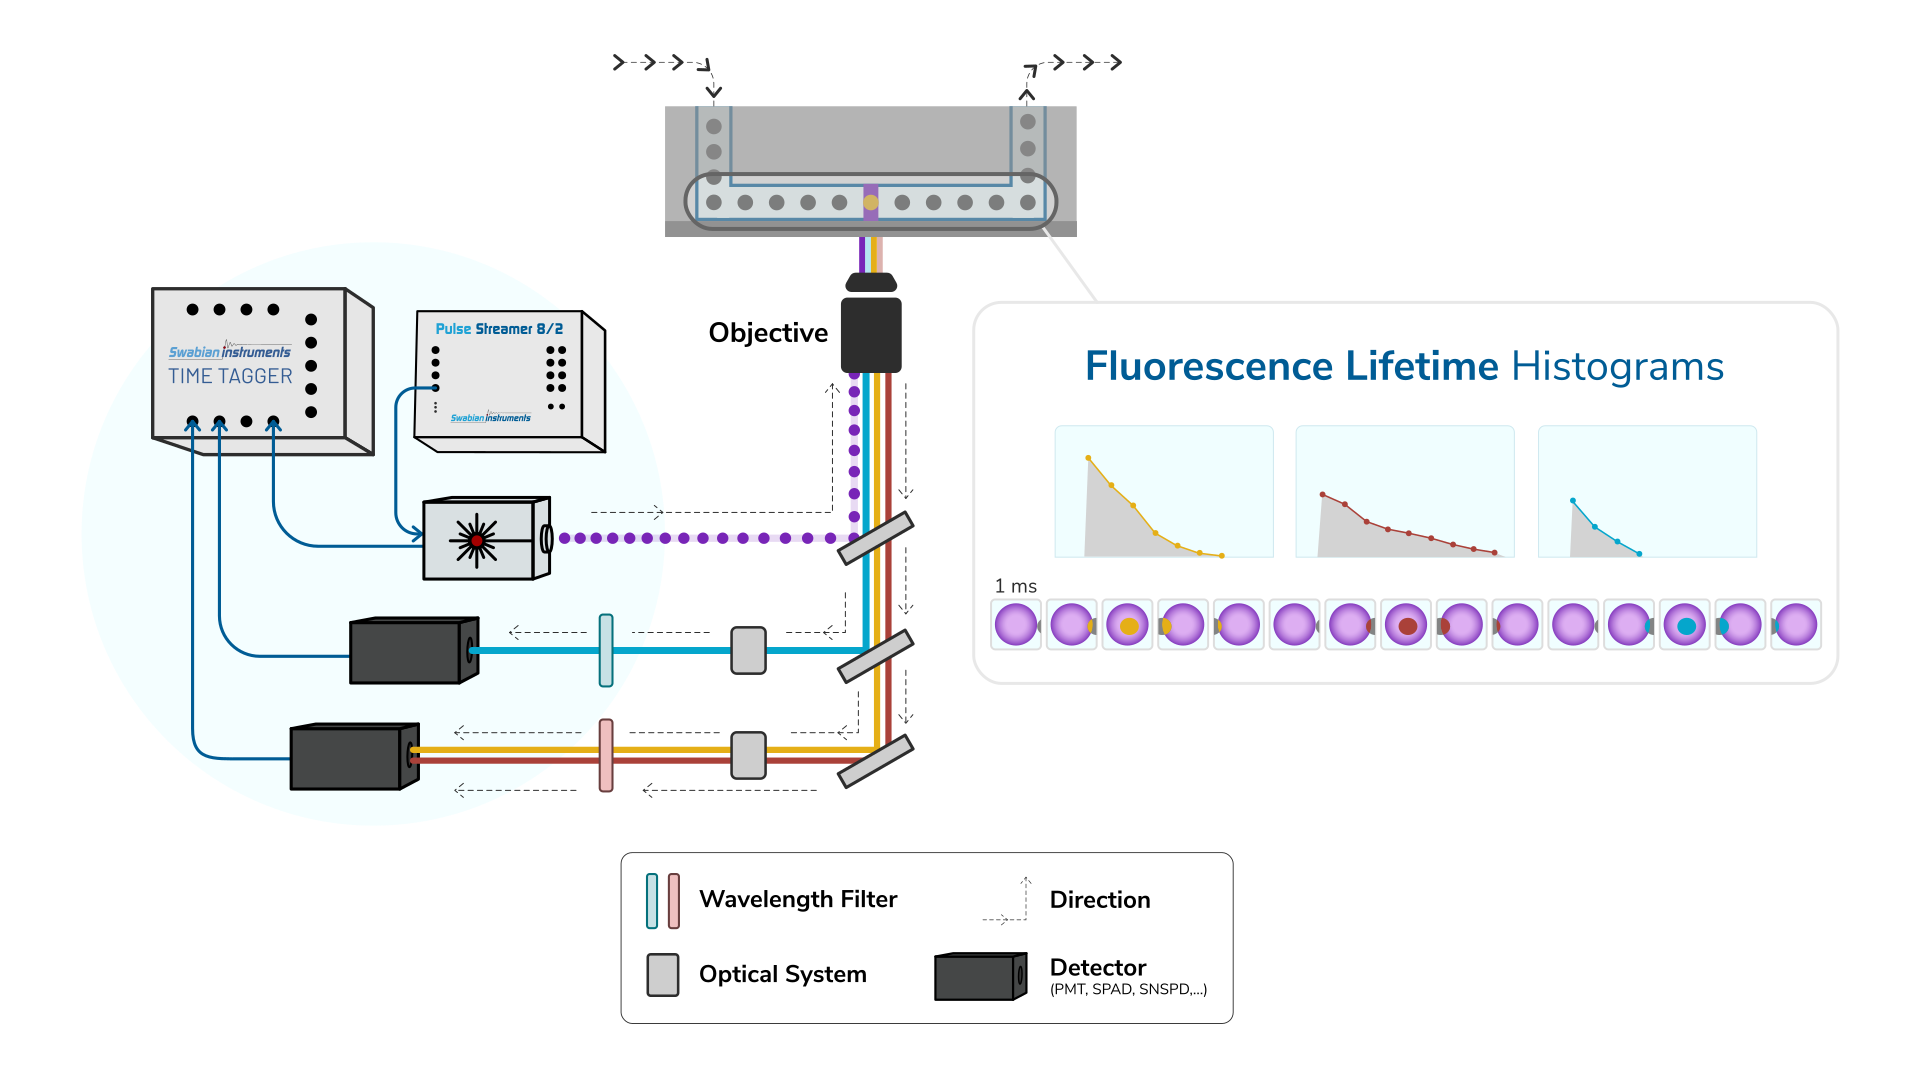
Fluorescence Lifetime Flow Cytometry (FLFC)
Flow cytometry is a sheath-flow-based technique that uses laser excitation and fluorescence to evaluate the physical and chemical characteristics of cells or other suspended particles in a fluid stream
Dynamic Light Scattering (DLS) Particle Size Analysis
Next-generation multi-angle DLS turnkey design with built-in consistency checks, raw photon access, and intelligent spike filtering for fast, reliable particle sizing.

Single-Photon Counting Raman Spectroscopy
The single-photon counting Raman spectroscopy combines the principles of Raman spectroscopy with single-photon counting techniques, enabling the detection of weak Raman signals even at low analyte concentrations
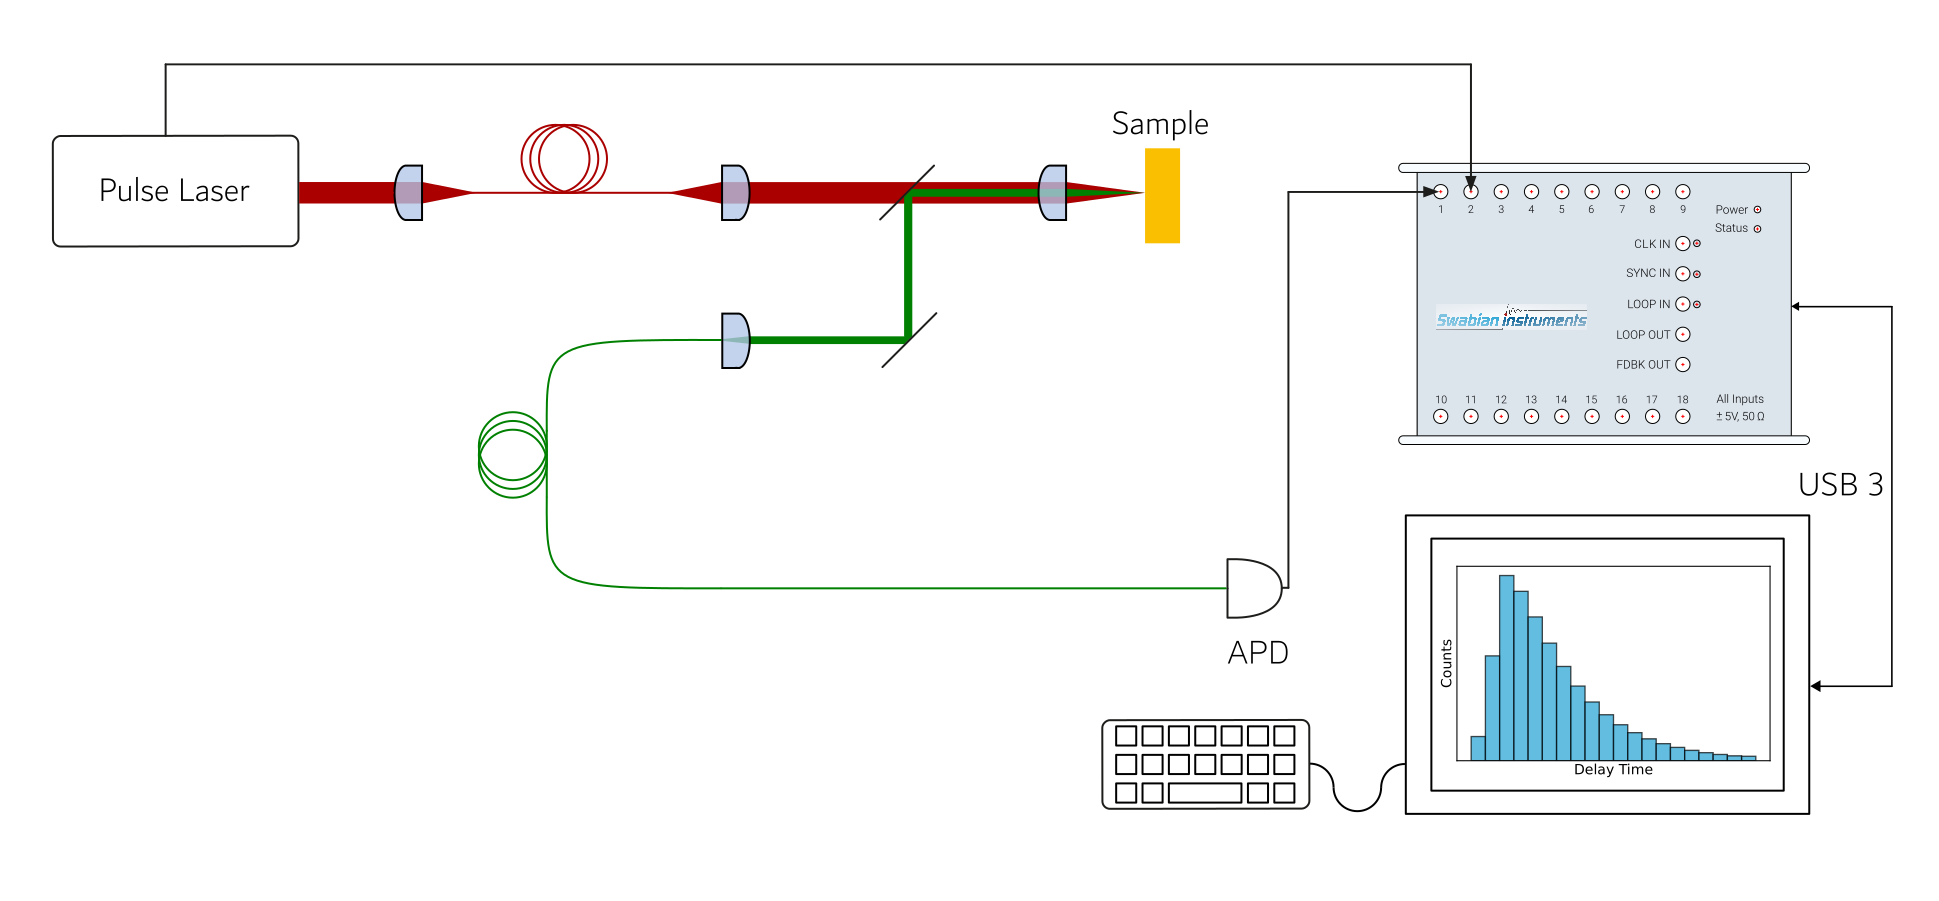
荧光寿命成像 (FLIM)
探索荧光寿命成像(FLIM)这一强大的成像技术,了解其如何以皮秒级精度绘制荧光寿命分布图。Swabian Instruments – 施瓦本仪器® Time Tagger 凭借先进的时间测量电子技术,支持光电倍增管(PMT)、单光子雪崩二极管(SPAD)和超导纳米线单光子探测器(SNSPD)等多种探测器,可实现高分辨率 FLIM 测量,助力前沿科研应用。
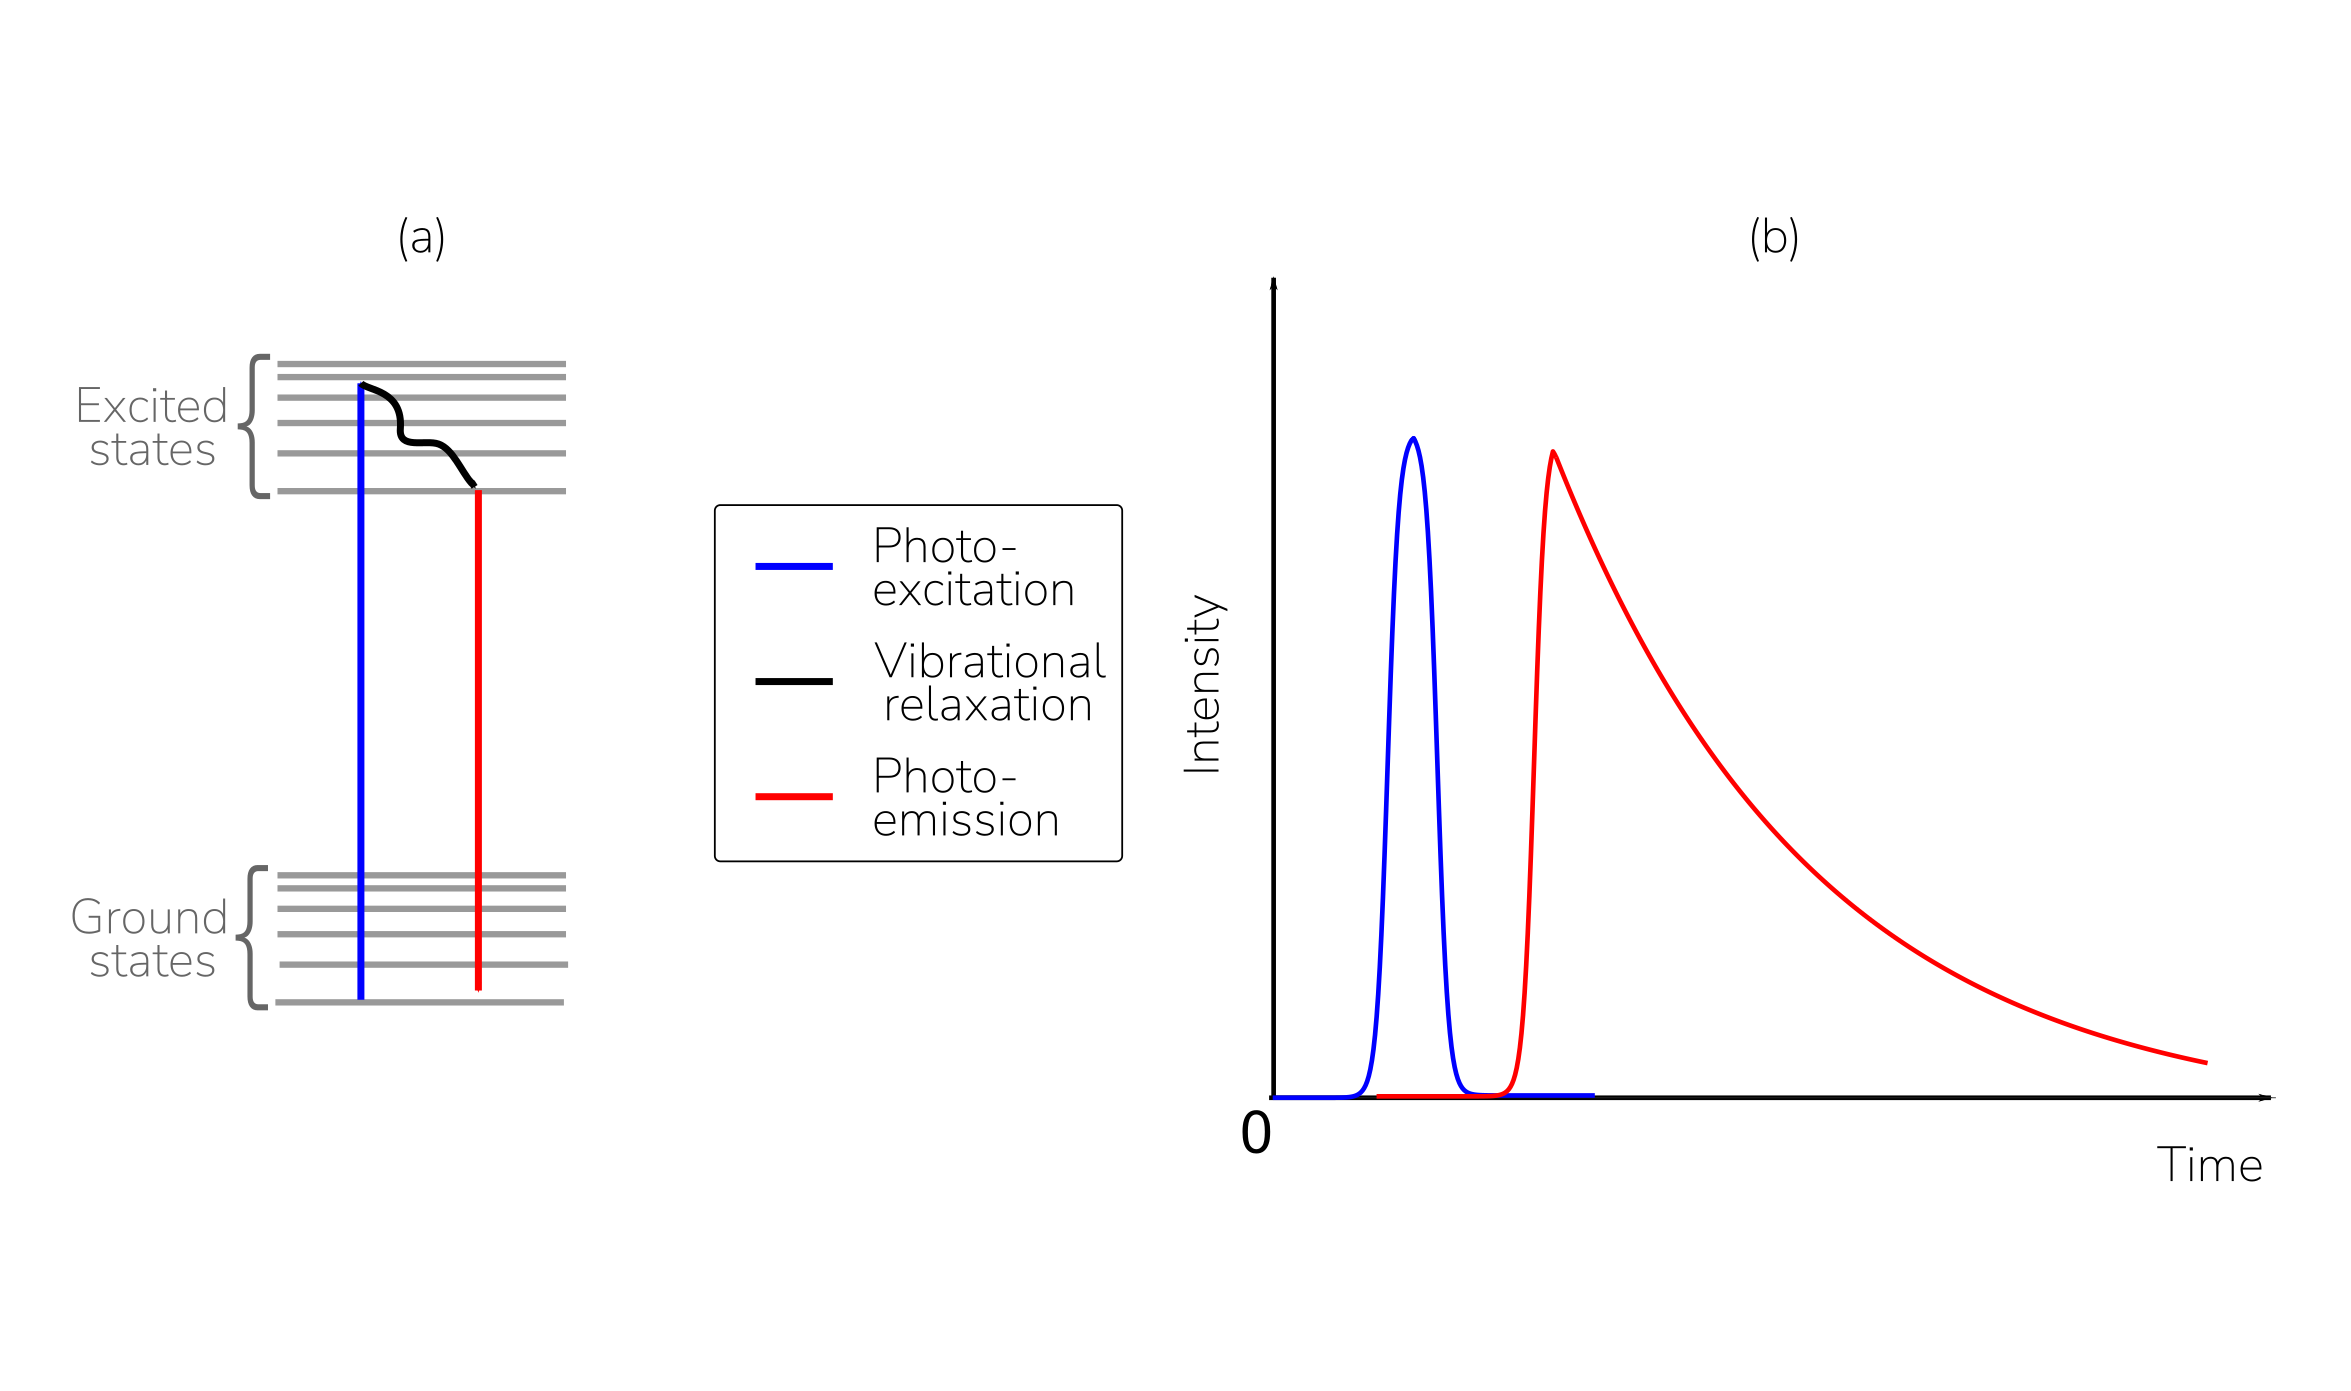
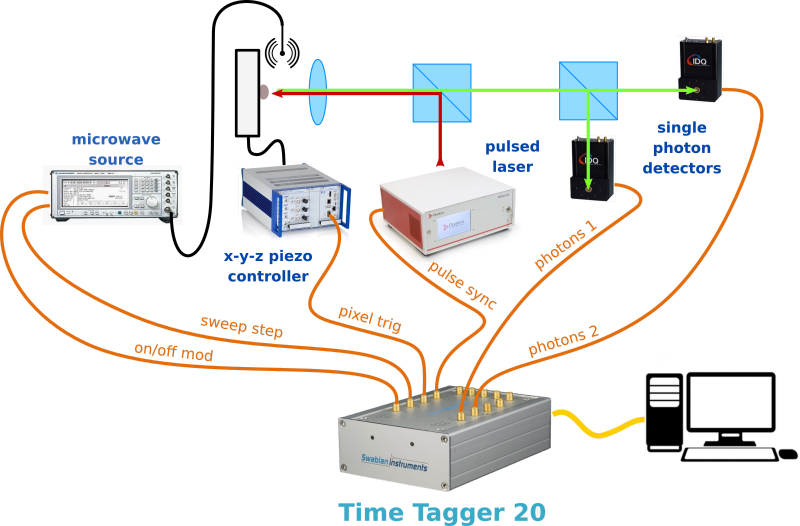
Time-Resolved Photoluminescence (TRPL)
Time-resolved photoluminescence (TRPL) is a powerful technique that measures the photoluminescence decay (emission lifetime) of materials after pulsed excitation, thereby probing their optical and electronic properties. By tracking how excited states relax back to the ground state, TRPL distinguishes between radiative and non-radiative pathways, yielding lifetimes that report on charge-carrier dynamics, trap/defect activity, and other loss mechanisms.
Life science encompasses a broad spectrum of scientific research evaluating the complexities of biological systems. This field includes the study of living organisms (structure and function), their life processes (origin, growth, evolution, distribution), and their relationships to each other within an ecosystem and with their environments. Breakthroughs in life sciences are required to advance healthcare, disease management, and our understanding of the fundamentals of life itself. By unraveling the mysteries of biological systems, life sciences research paves the way for innovative medical therapies, vaccines, and diagnostics, contributing significantly to enhancing life quality and extending life expectancy.
Swabian Instruments’ Time Taggers and time-correlated single photon counting (TCSPC) implementations are pivotal in life sciences as tools for studying cellular processes and molecular interactions with unmatched temporal precision via high-resolution fluorescence lifetime imaging and fluorescence correlation spectroscopy.